Sell Signal Triggered
Nothing good tends to happen in the stock market when our trend model says ‘Sell’.
Nobody rings a bell at the top, they say. Unless of course you have access to our technical trend indicator updates. Our TTI model timed the top of the 2007 and 2022 bull markets to perfection. We are getting close once again to another Sell signal. Will it be a pause to recharge this powerful equity bull market, or something more sinister? We are about to find out. - 11th September 2026.
Last week, we warned of a change in character in the stock market. We even included a bell as the main blog post image. This week, we have confirmation of a Sell signal in our technical studies. It is time for portfolio adjustment, capital preservation and patience.
Market Summary
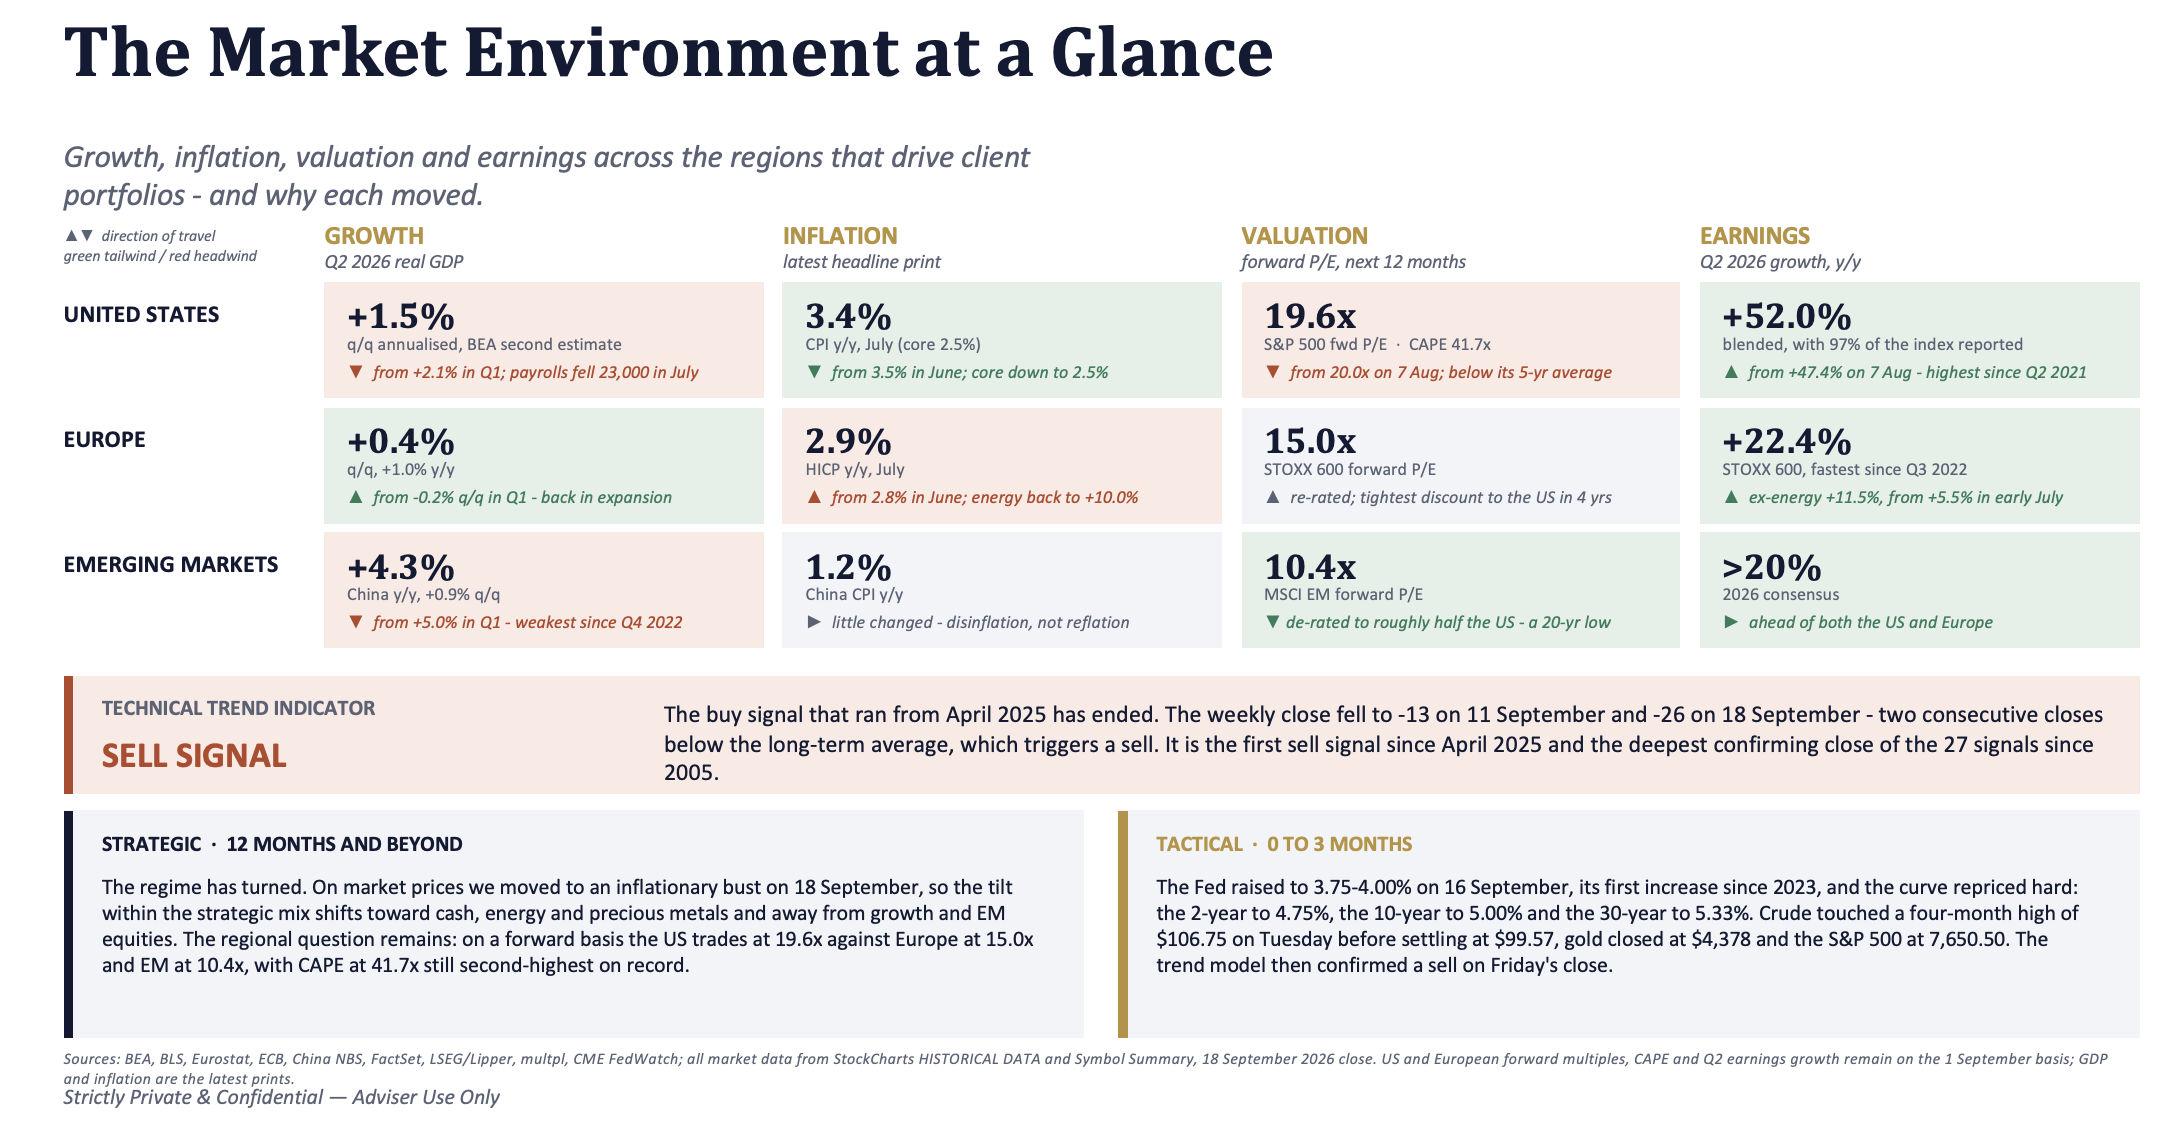
Here is a snapshot of current growth, inflation, valuation and earnings metrics for the US, Europe and emerging markets.
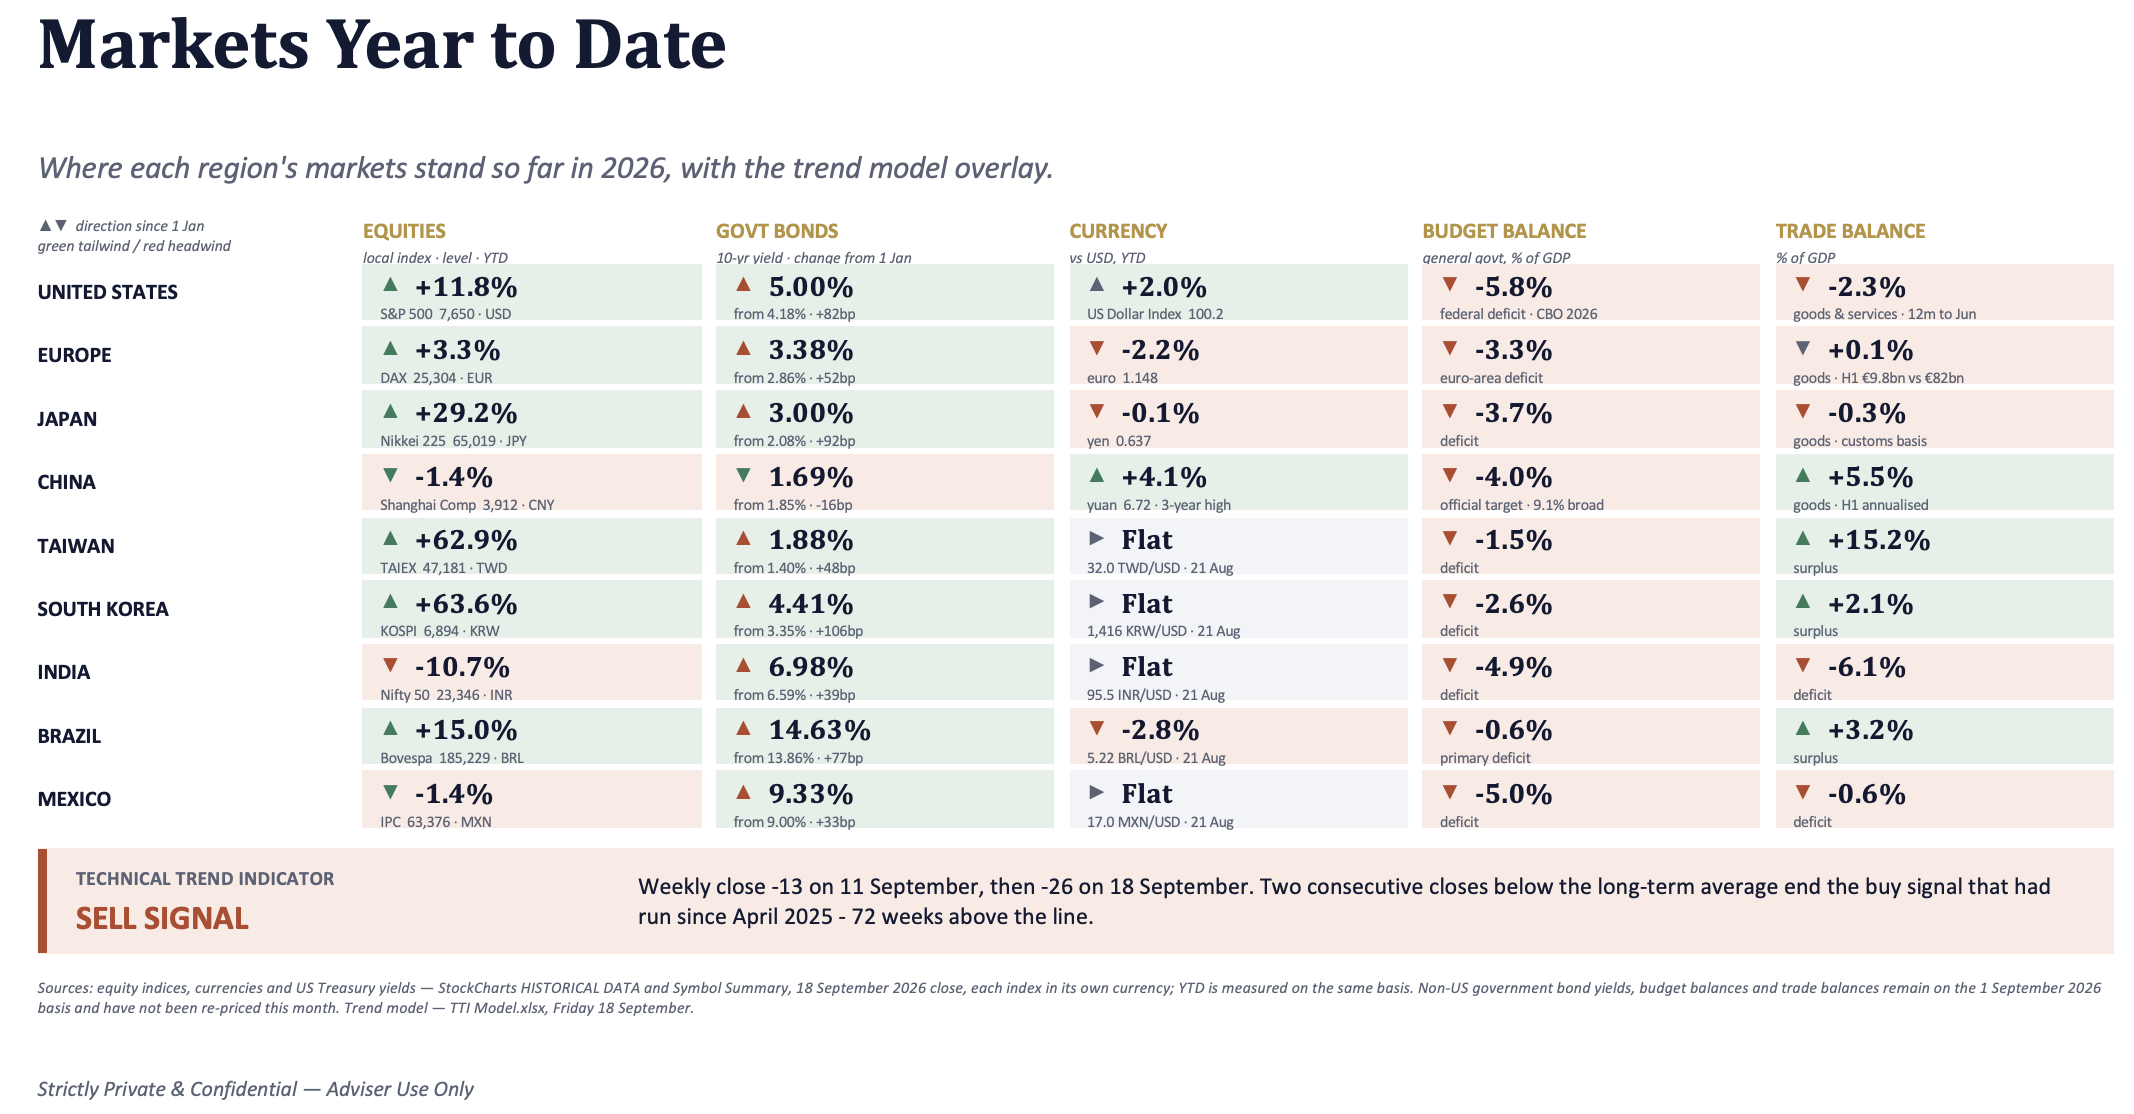
…. and some key market performance statistics year-to-date.
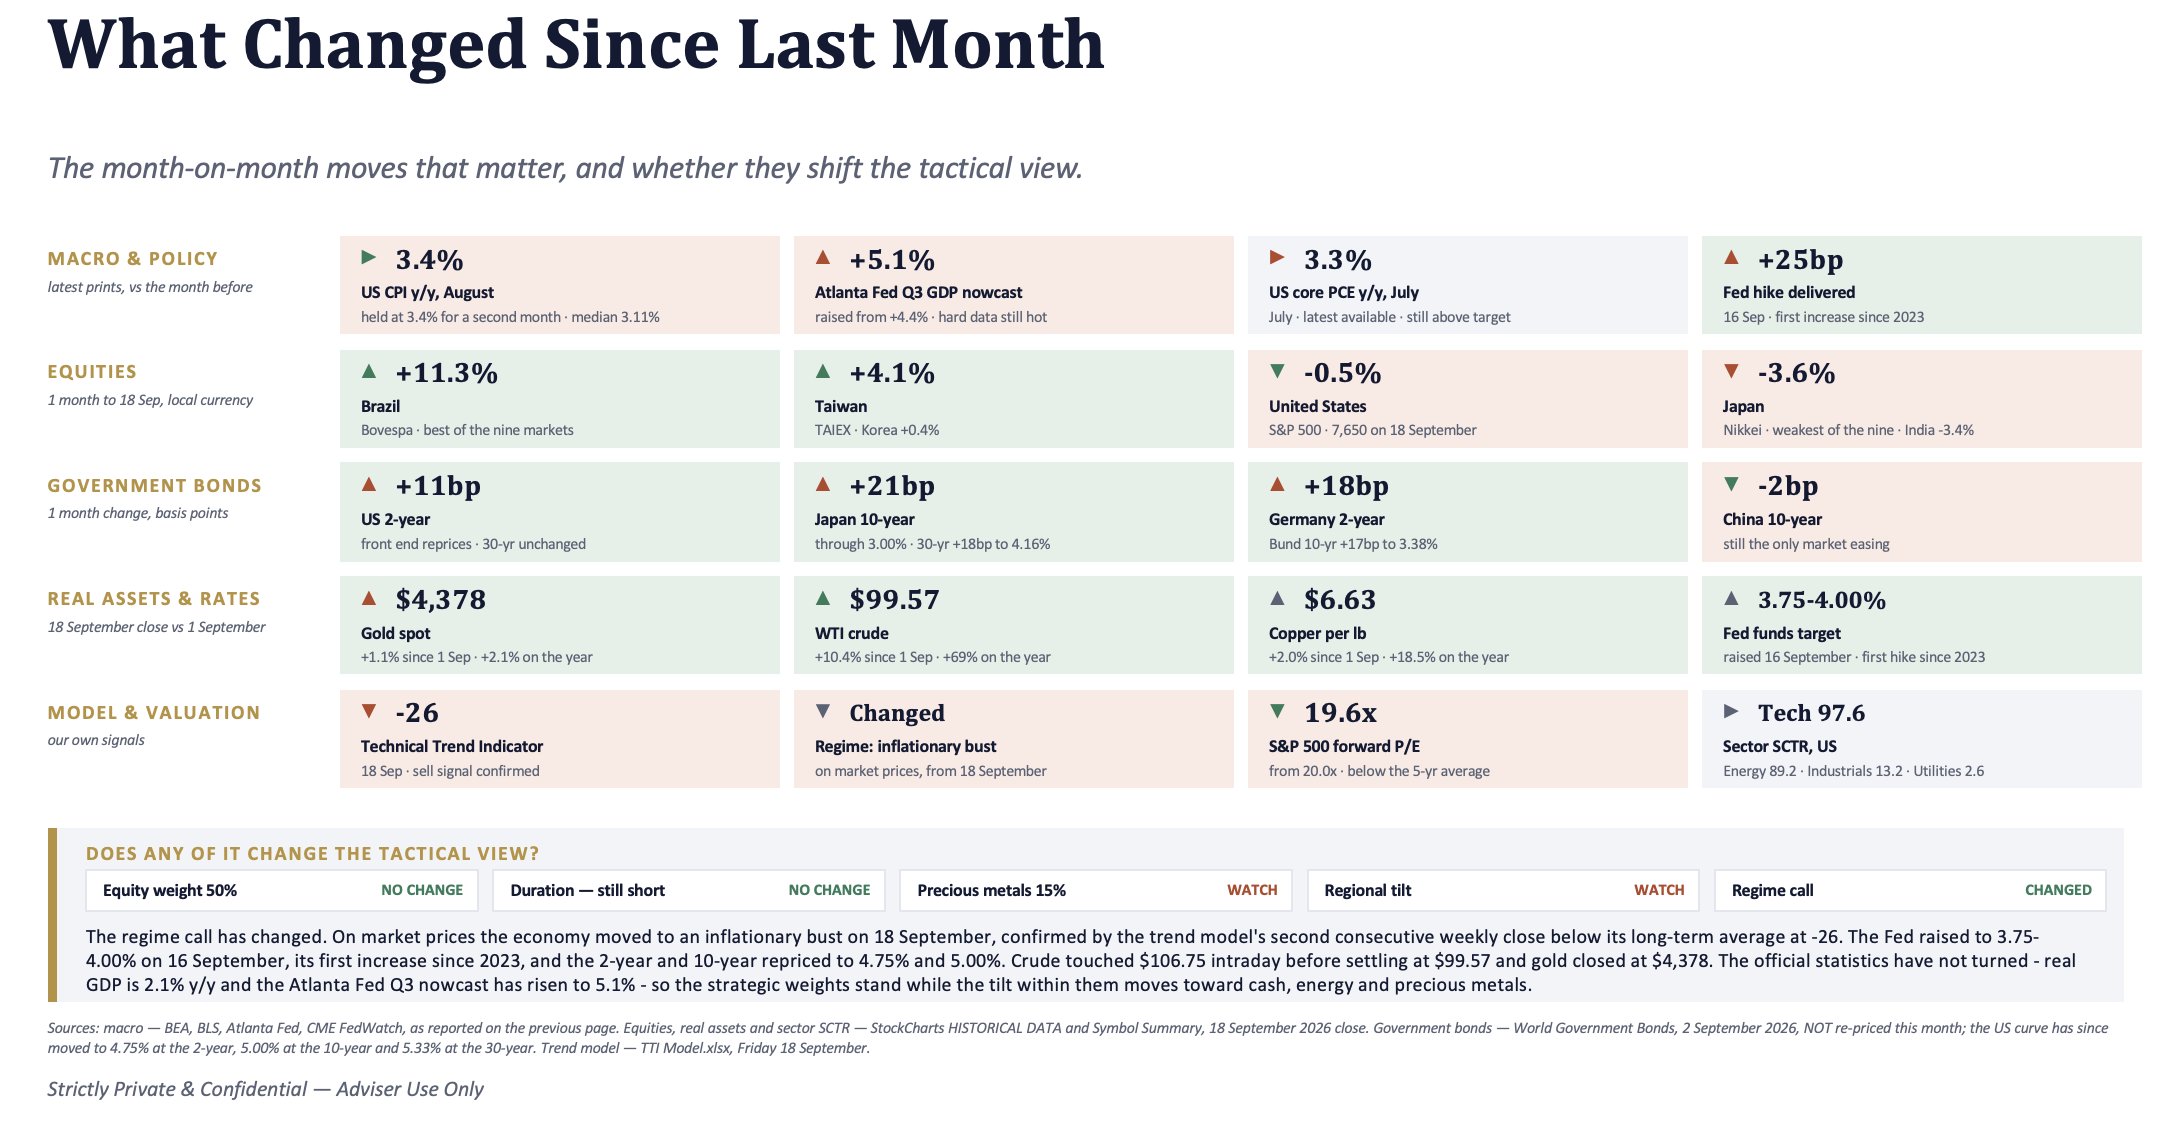
What has changed since last month?
Quadrant/Regime - Inflationary Boom
Government data suggest we remain in an inflationary boom, a period of improving real economic growth and rising inflation each quarter. In an inflationary boom, commodities, gold in particular, and equities in nominal terms tend to perform quite well. Government bonds and the dollar are underweights in a rising growth, rising inflationary environment.
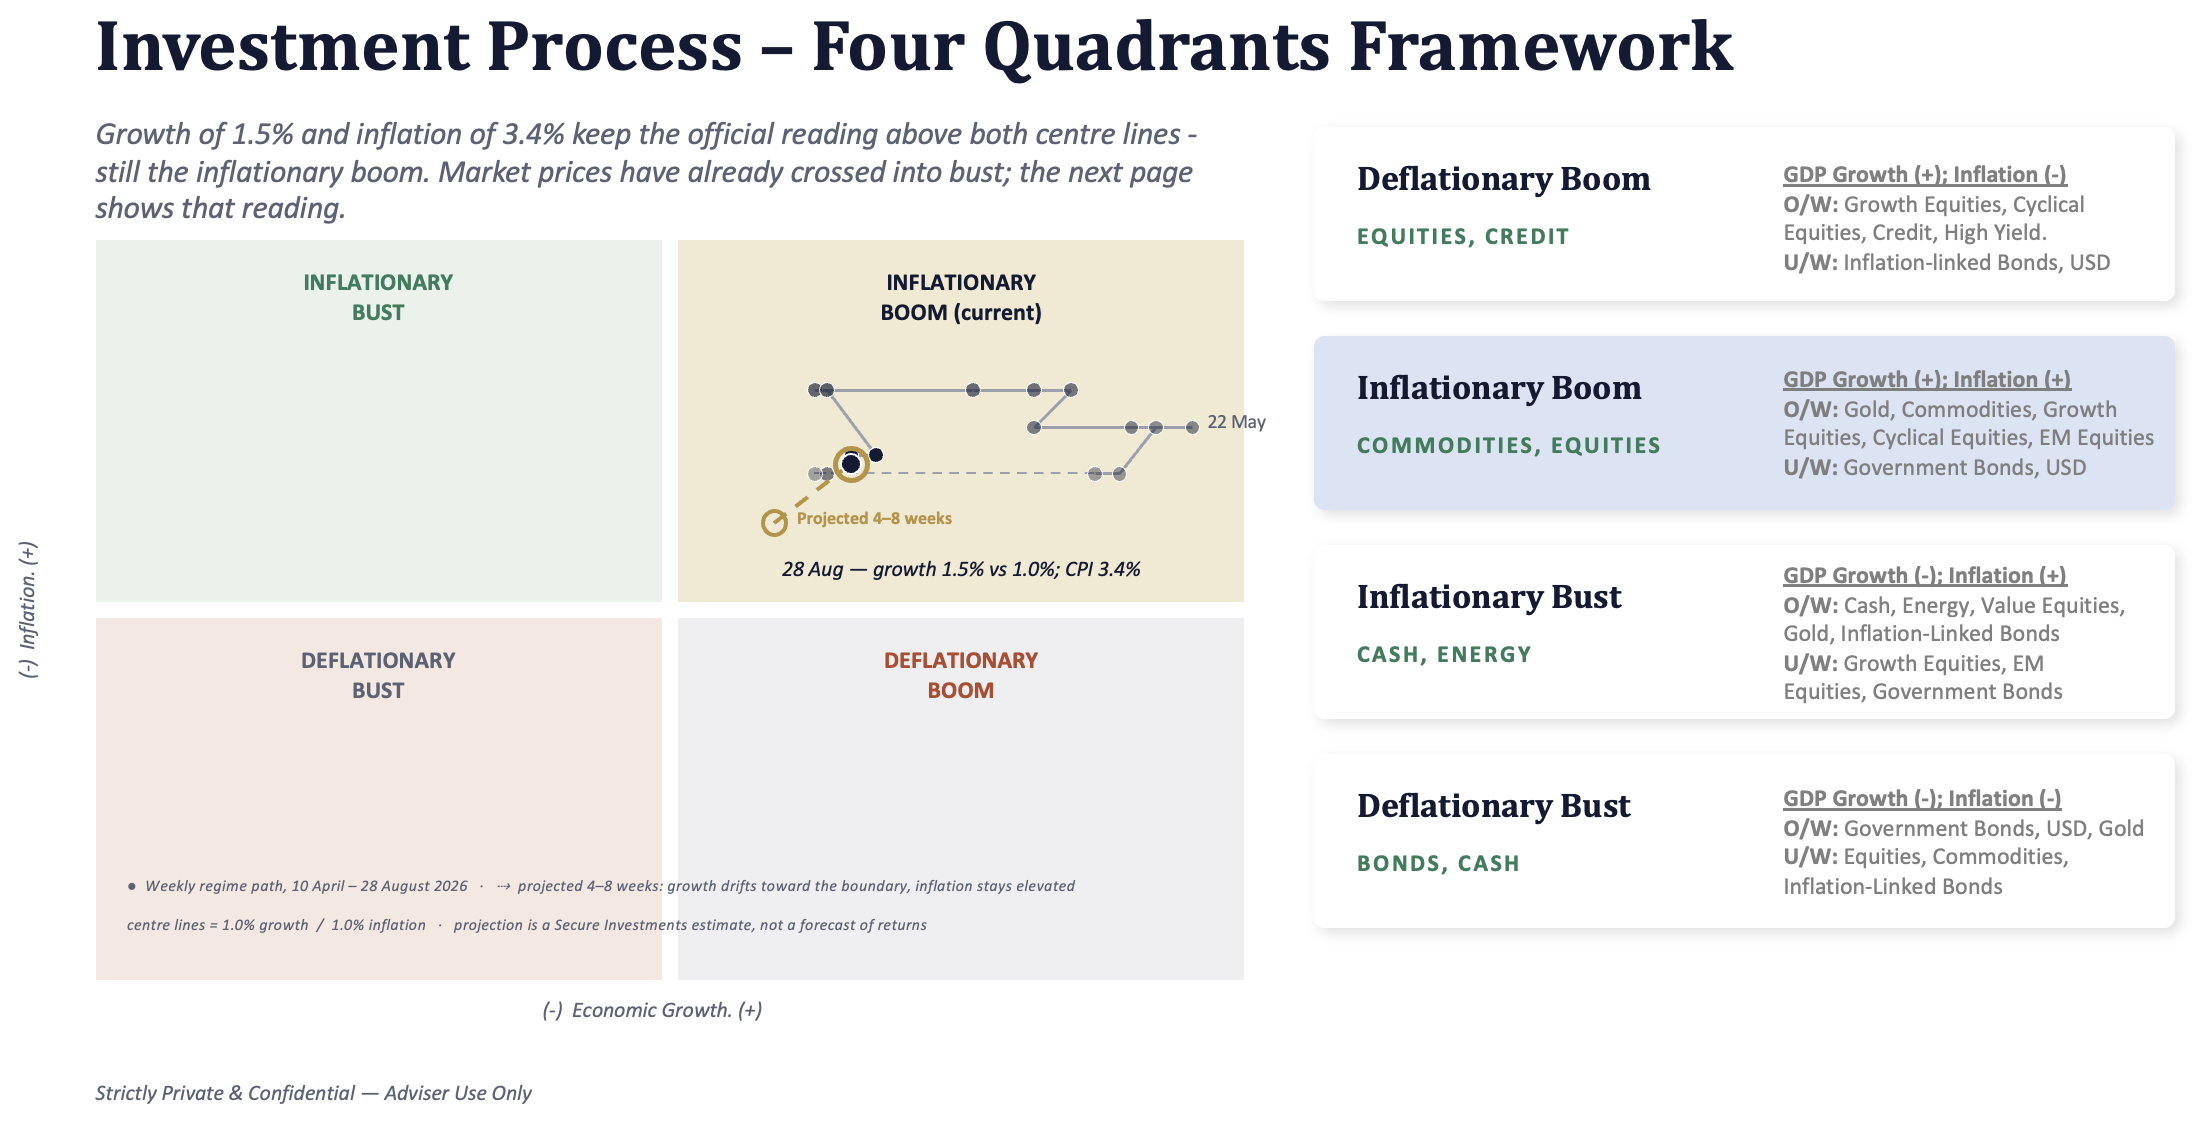
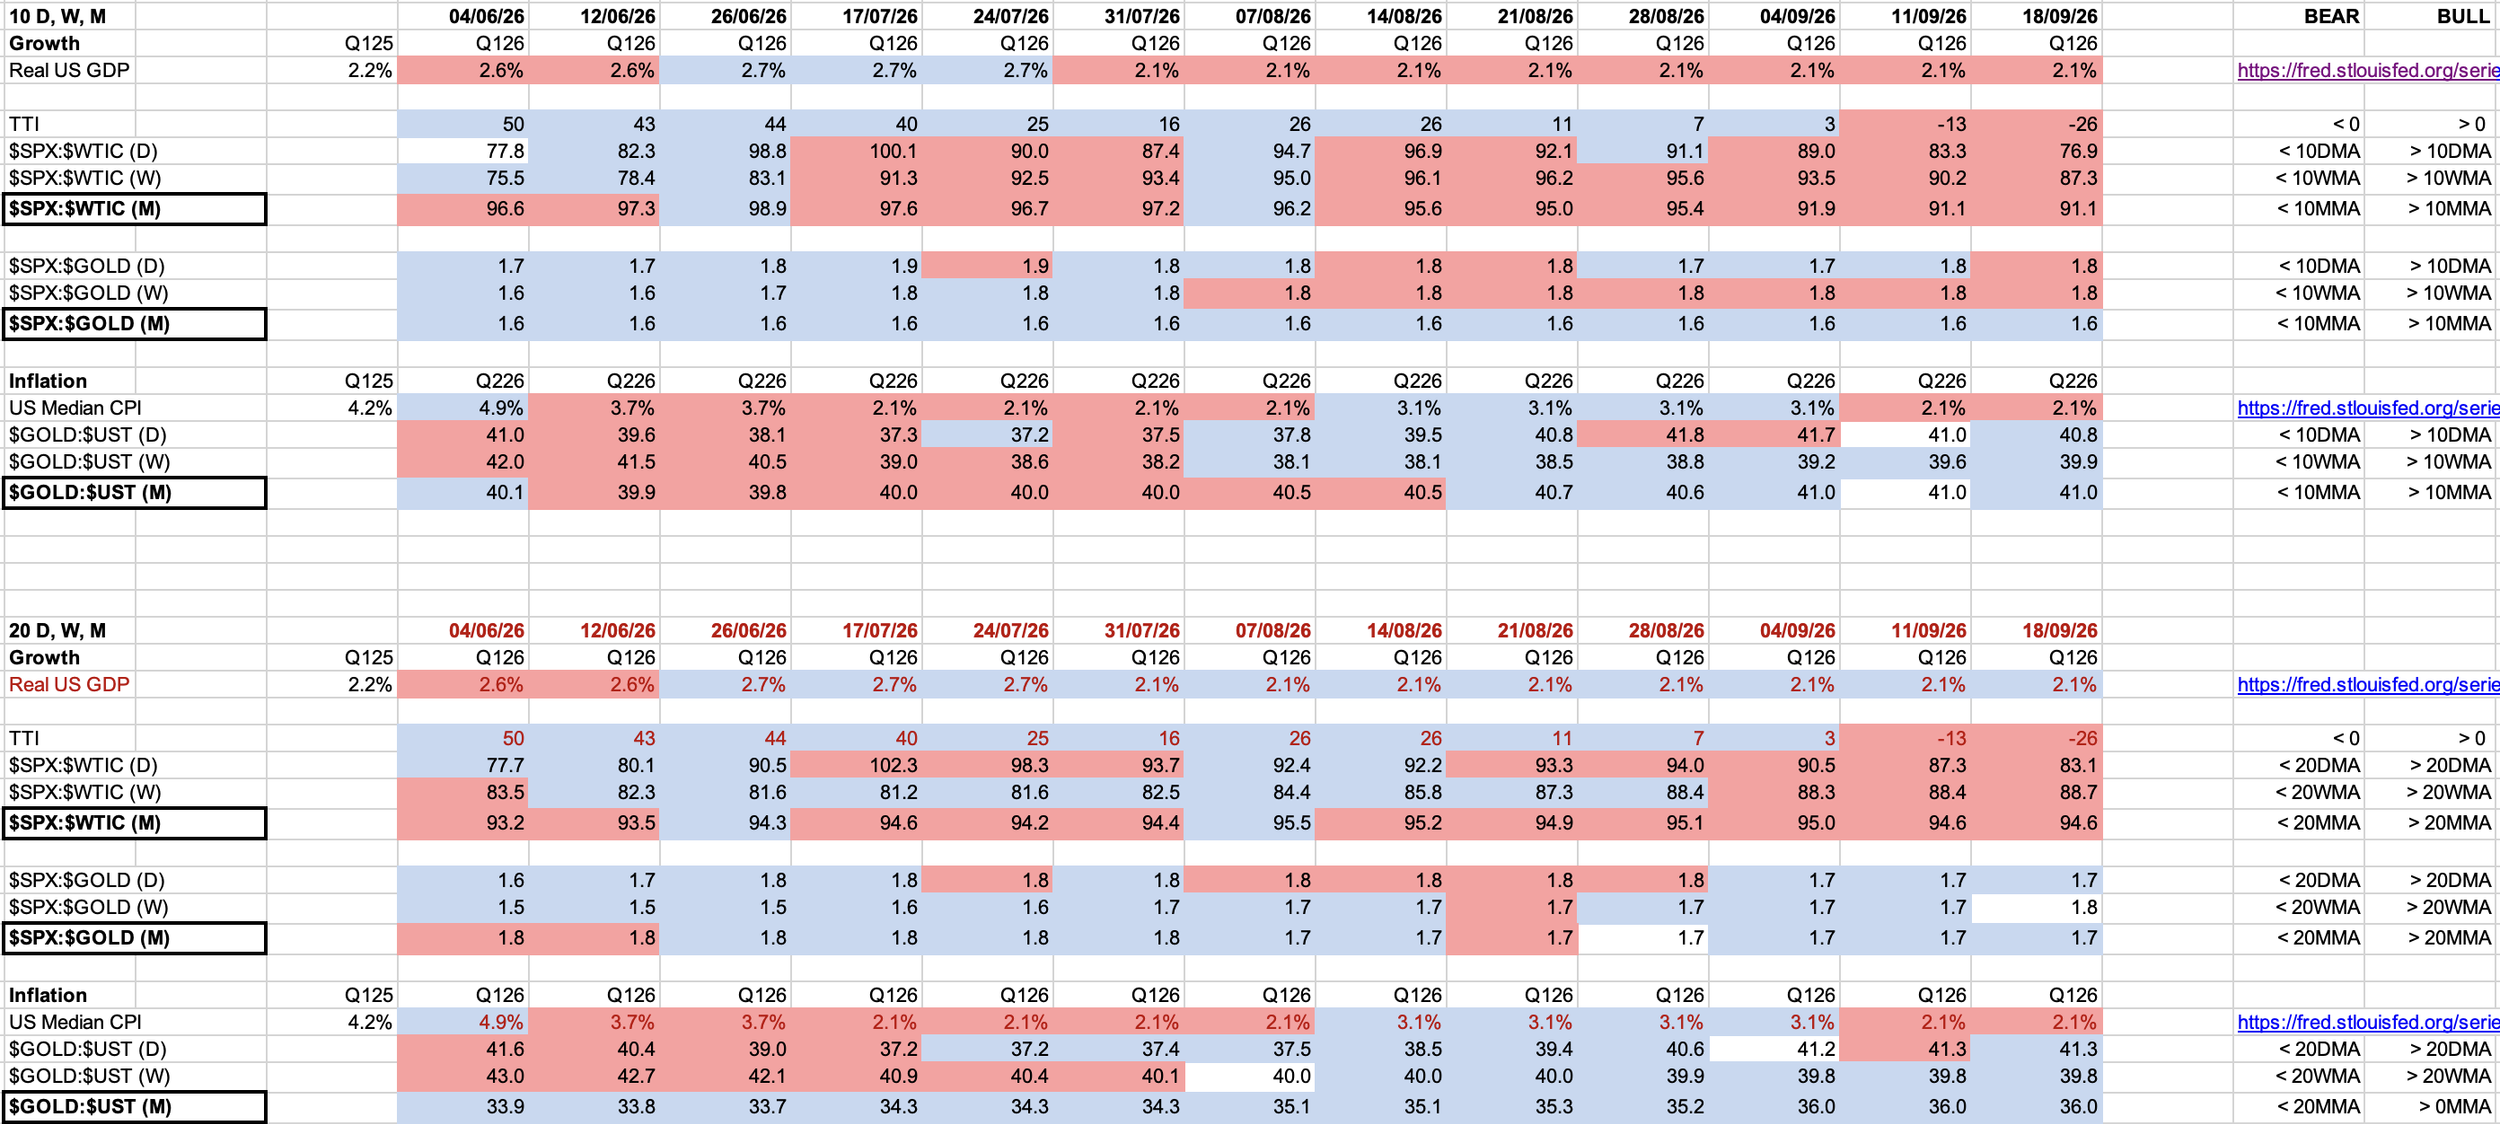
However, when you focus on market data instead of government statistics, combined with a study of the stock market’s technical trend, another more concerning picture begins to emerge. When equities underperform energy prices on a consistent basis, and gold outperforms US Treasuries, this signals increasing risk of an inflationary bust regime taking hold. Add in a deteriorating technical condition in the stock market and odds of an inflationary bust increase again. This is the environment in which we find ourselves today.
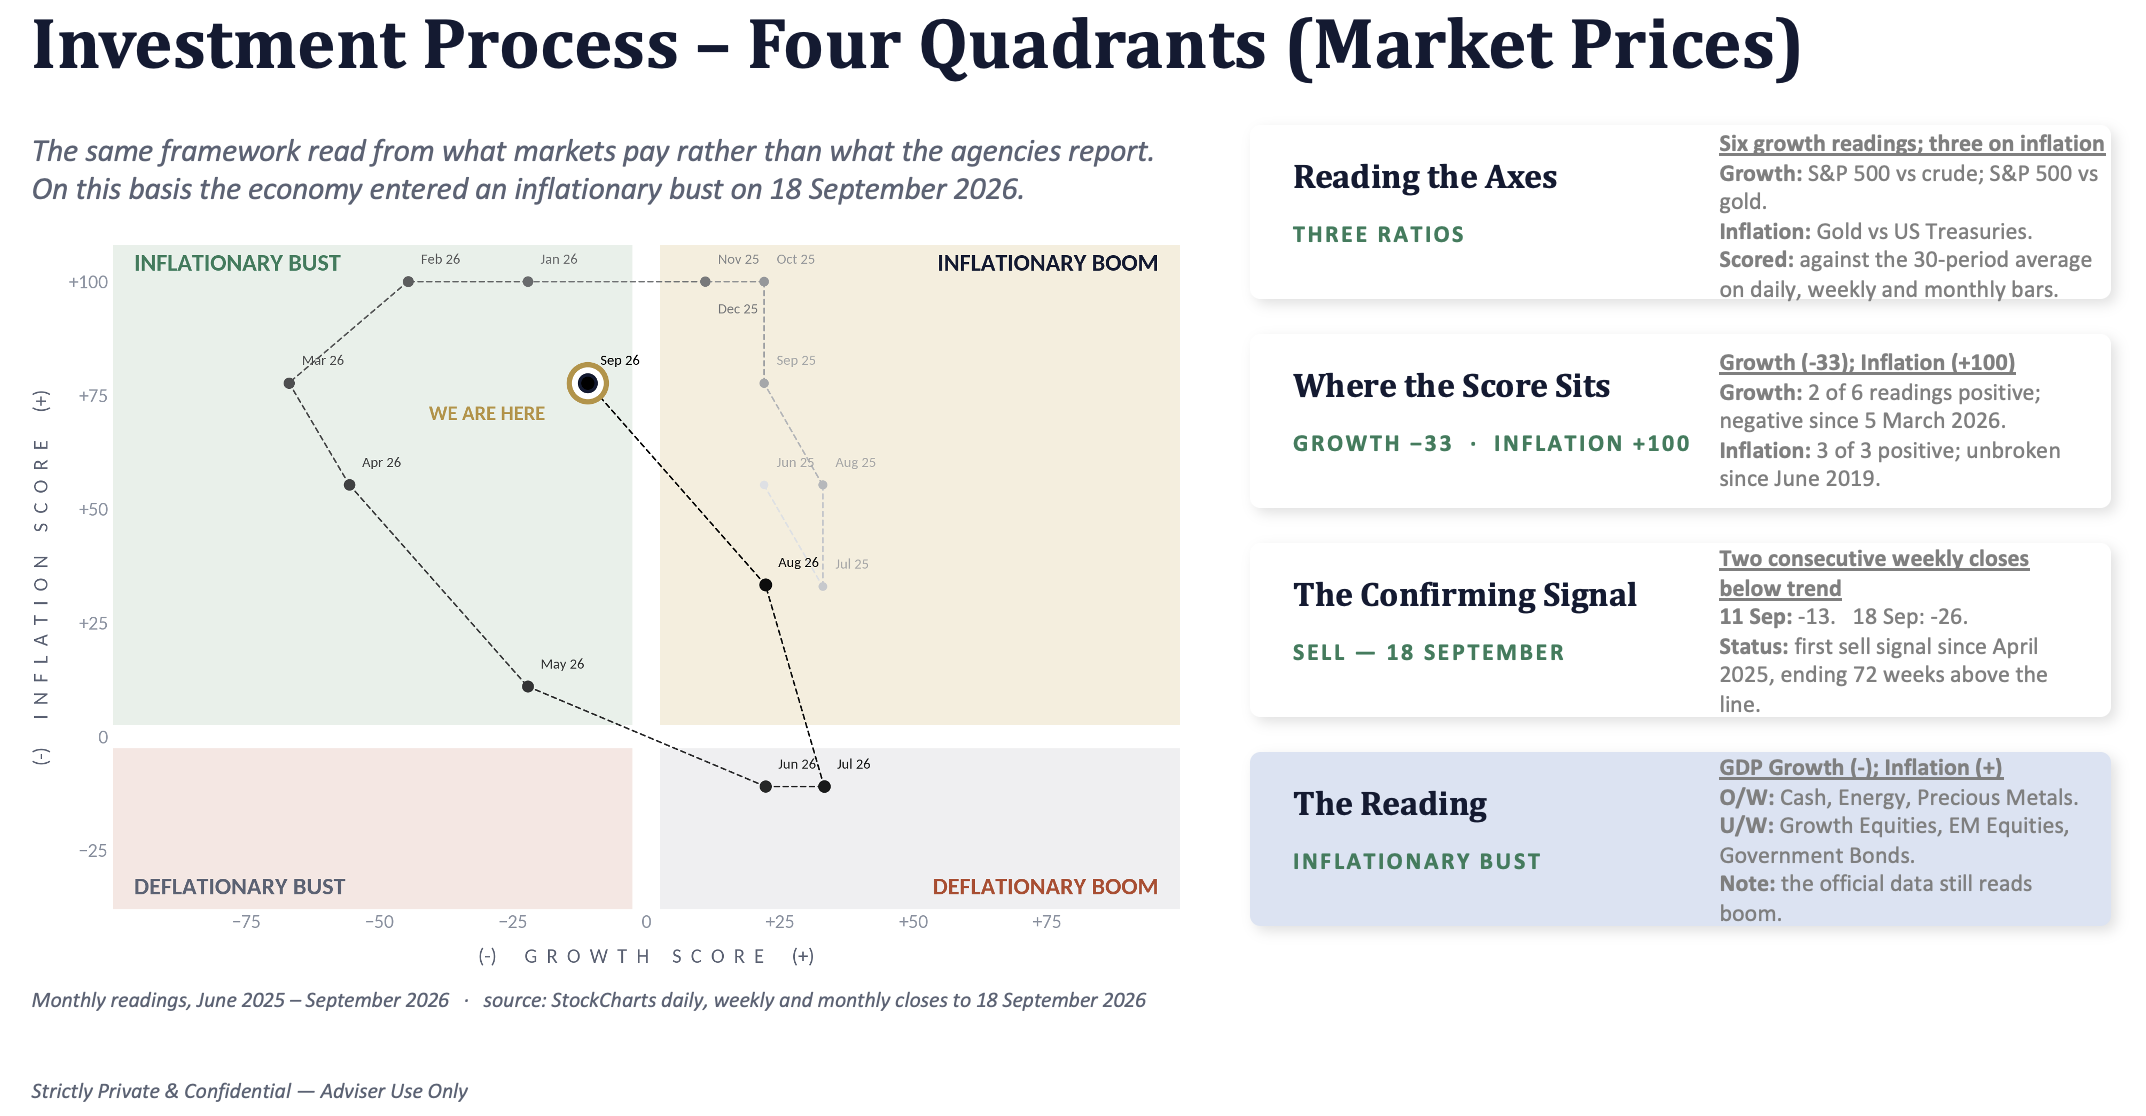
Periods of stagnating or declining economic growth and rising inflation tend to be the worst of all environments for equity investors. Cash, energy and precious metals outperform while equities and government bonds suffer sharp drawdowns.
Equities
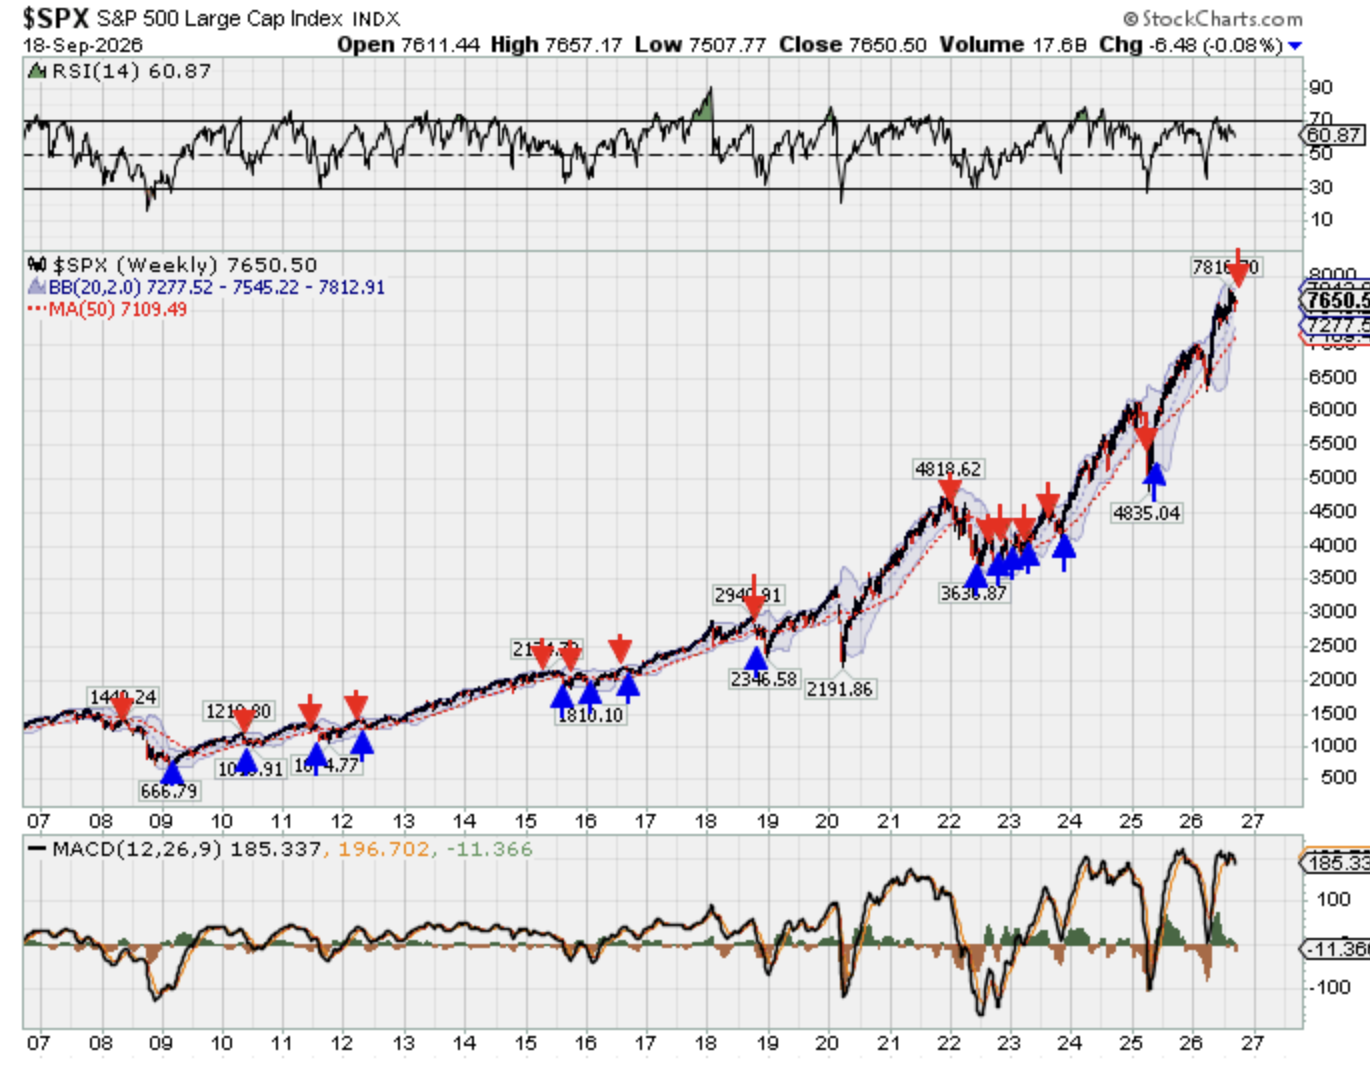
Our Technical Trend Indicator closed the week -26 points below its long-term average; a second consecutive weekly closes below trend, triggering a sell signal in our technical studies. We are defensively positioned 20% equities / 15% bonds / 45% precious metals / 20% cash in our multi-asset strategy. Our equity exposure is in the energy and materials sectors. Both sectors tend to outperform in an inflationary bust environment.
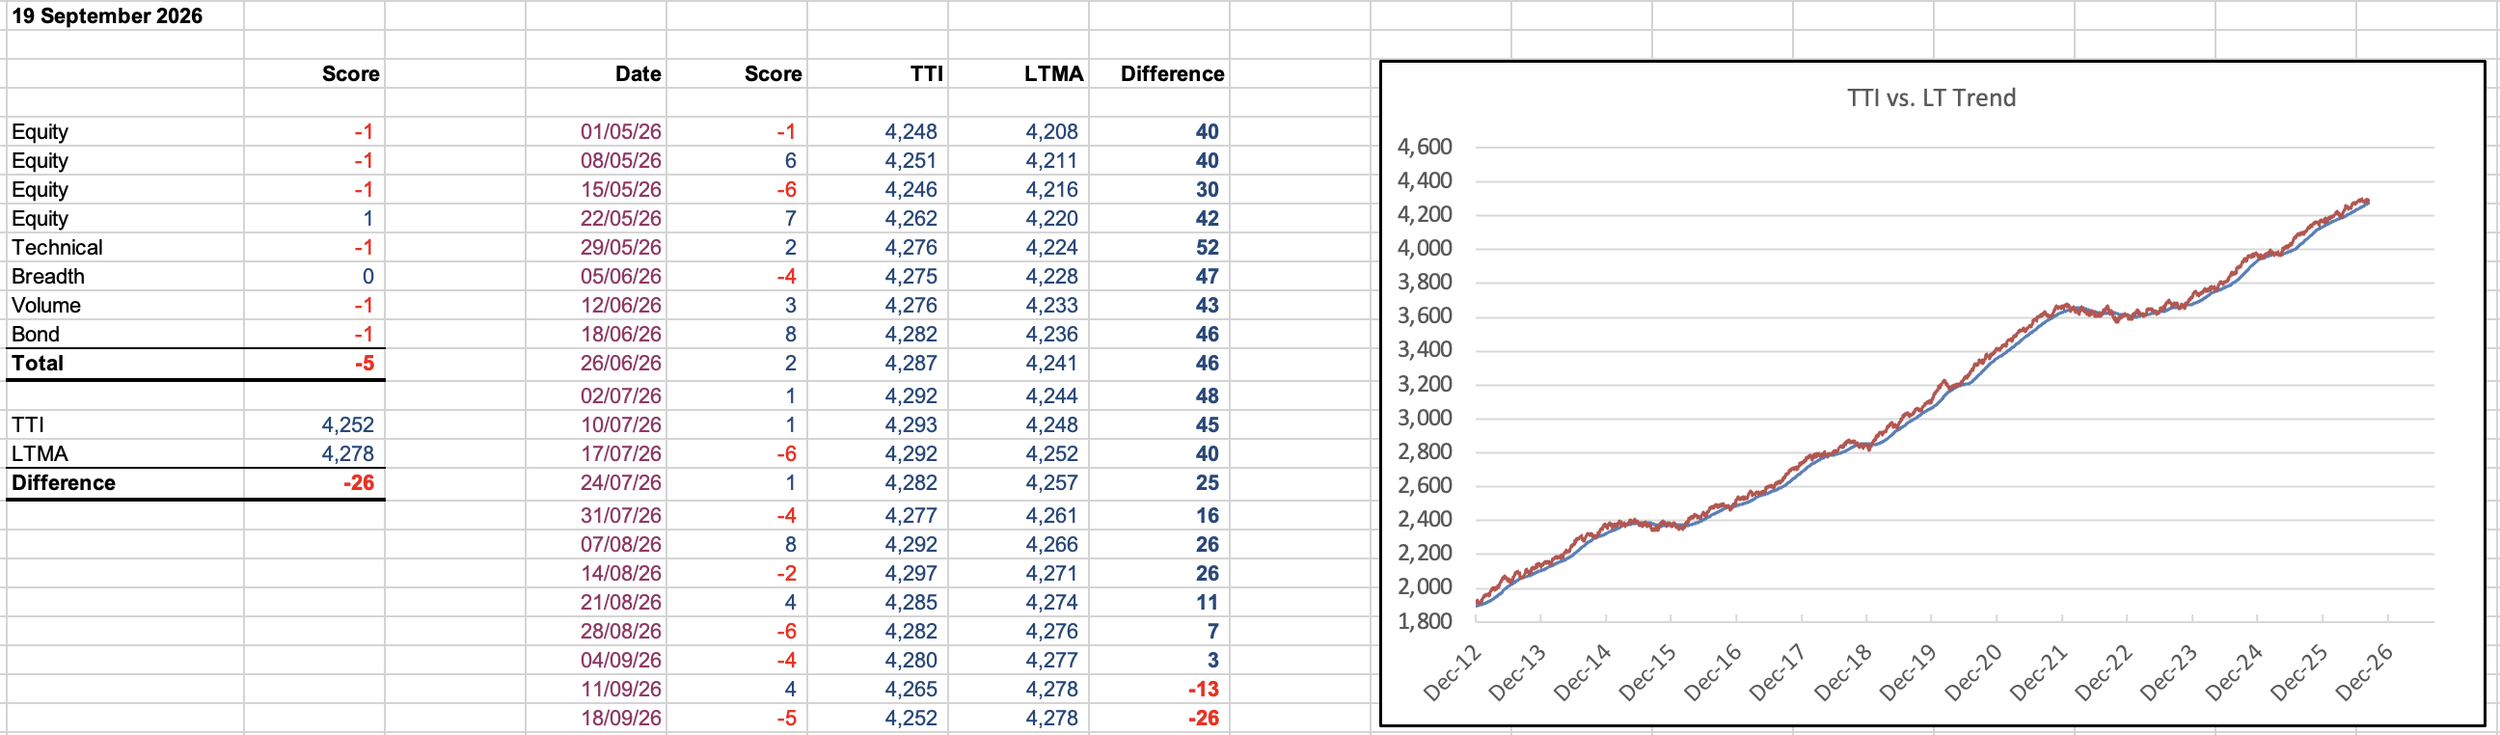
We are starting to see some red on the board as an increasing number of the technical indicators we follow begin to roll over (sample set below). Whether this is simple mean reversion event or the start of a larger correction, it is too early to tell. We are exercising caution. The US stock market made an expanding 153 net new lows last week. A stock market that makes an increasing number of new lows each week is not a market that shows signs of strength. Caution is warranted.
In an inflationary bust, equities underperform energy, gold outperforms US Treasuries, and gold also tends to outperform equities over time. Each of these trends are in force today in varying degrees. Gold has been correcting in price in 2026 after a huge move last year and has been underperforming the S&P 500 in recent months. That trend is slowly starting to turn back in favour of the precious metal. Gold is now outperforming US Treasuries on 10 day, week, month and 20 day, week, month moving average bases today.
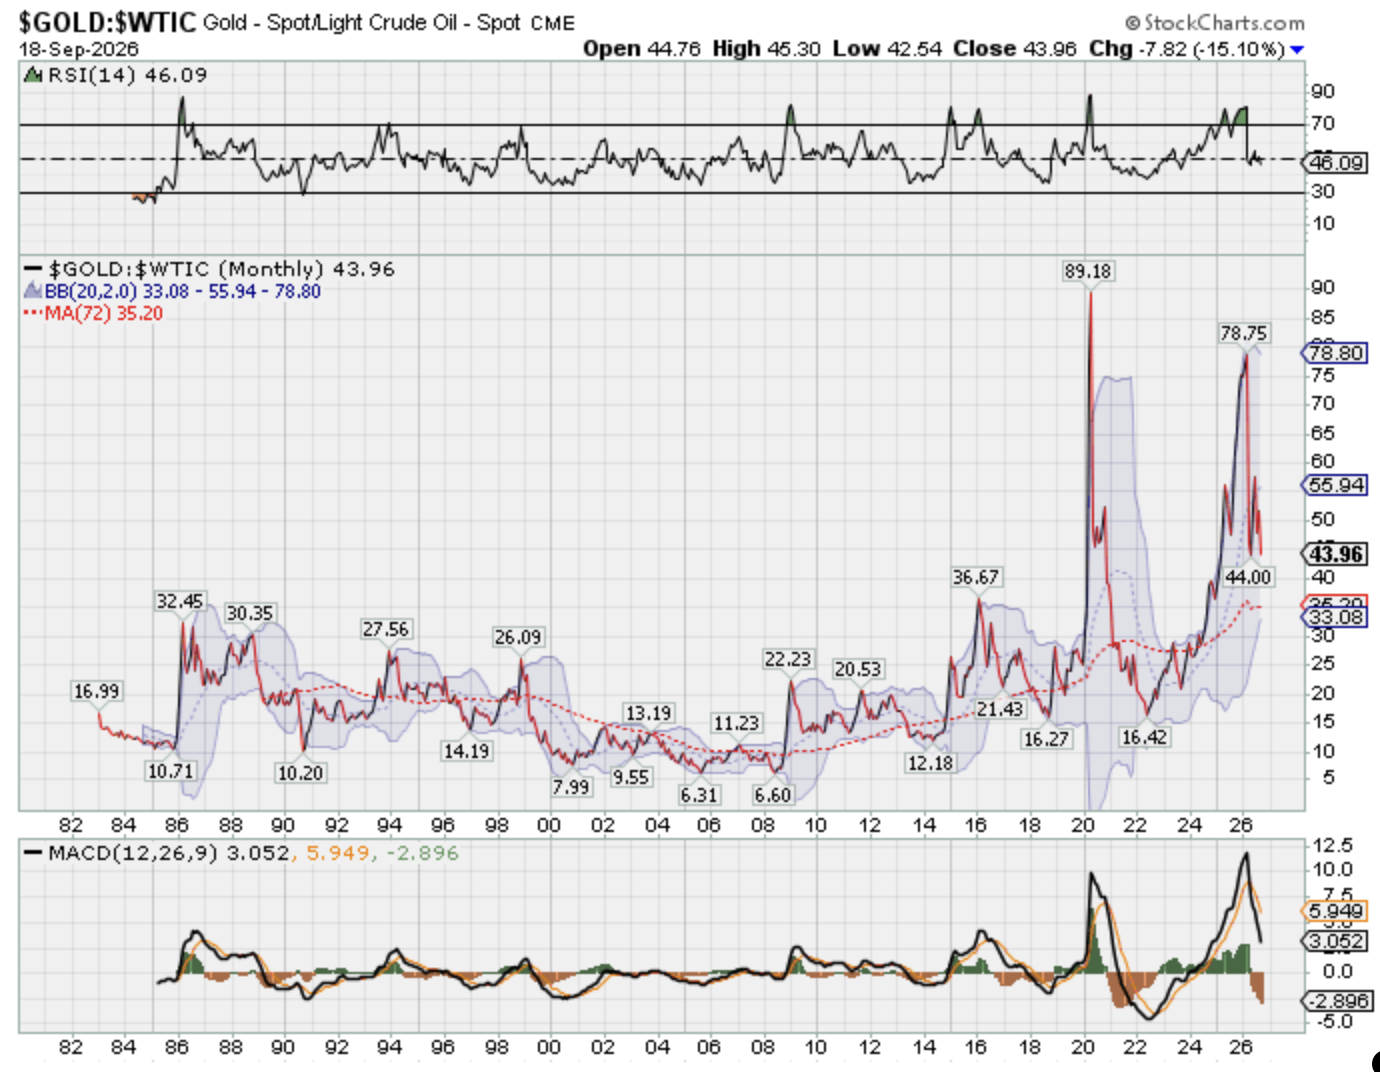
Exposure to the energy sector provides an excellent hedge in an inflationary bust. At the beginning of 2026, one ounce of gold bought 79 barrels of crude oil. Today, one ounce of gold buys just 44 ounces of gold. Energy is being repriced in the market. Crude oil prices could double from here before becoming expensive in gold terms.
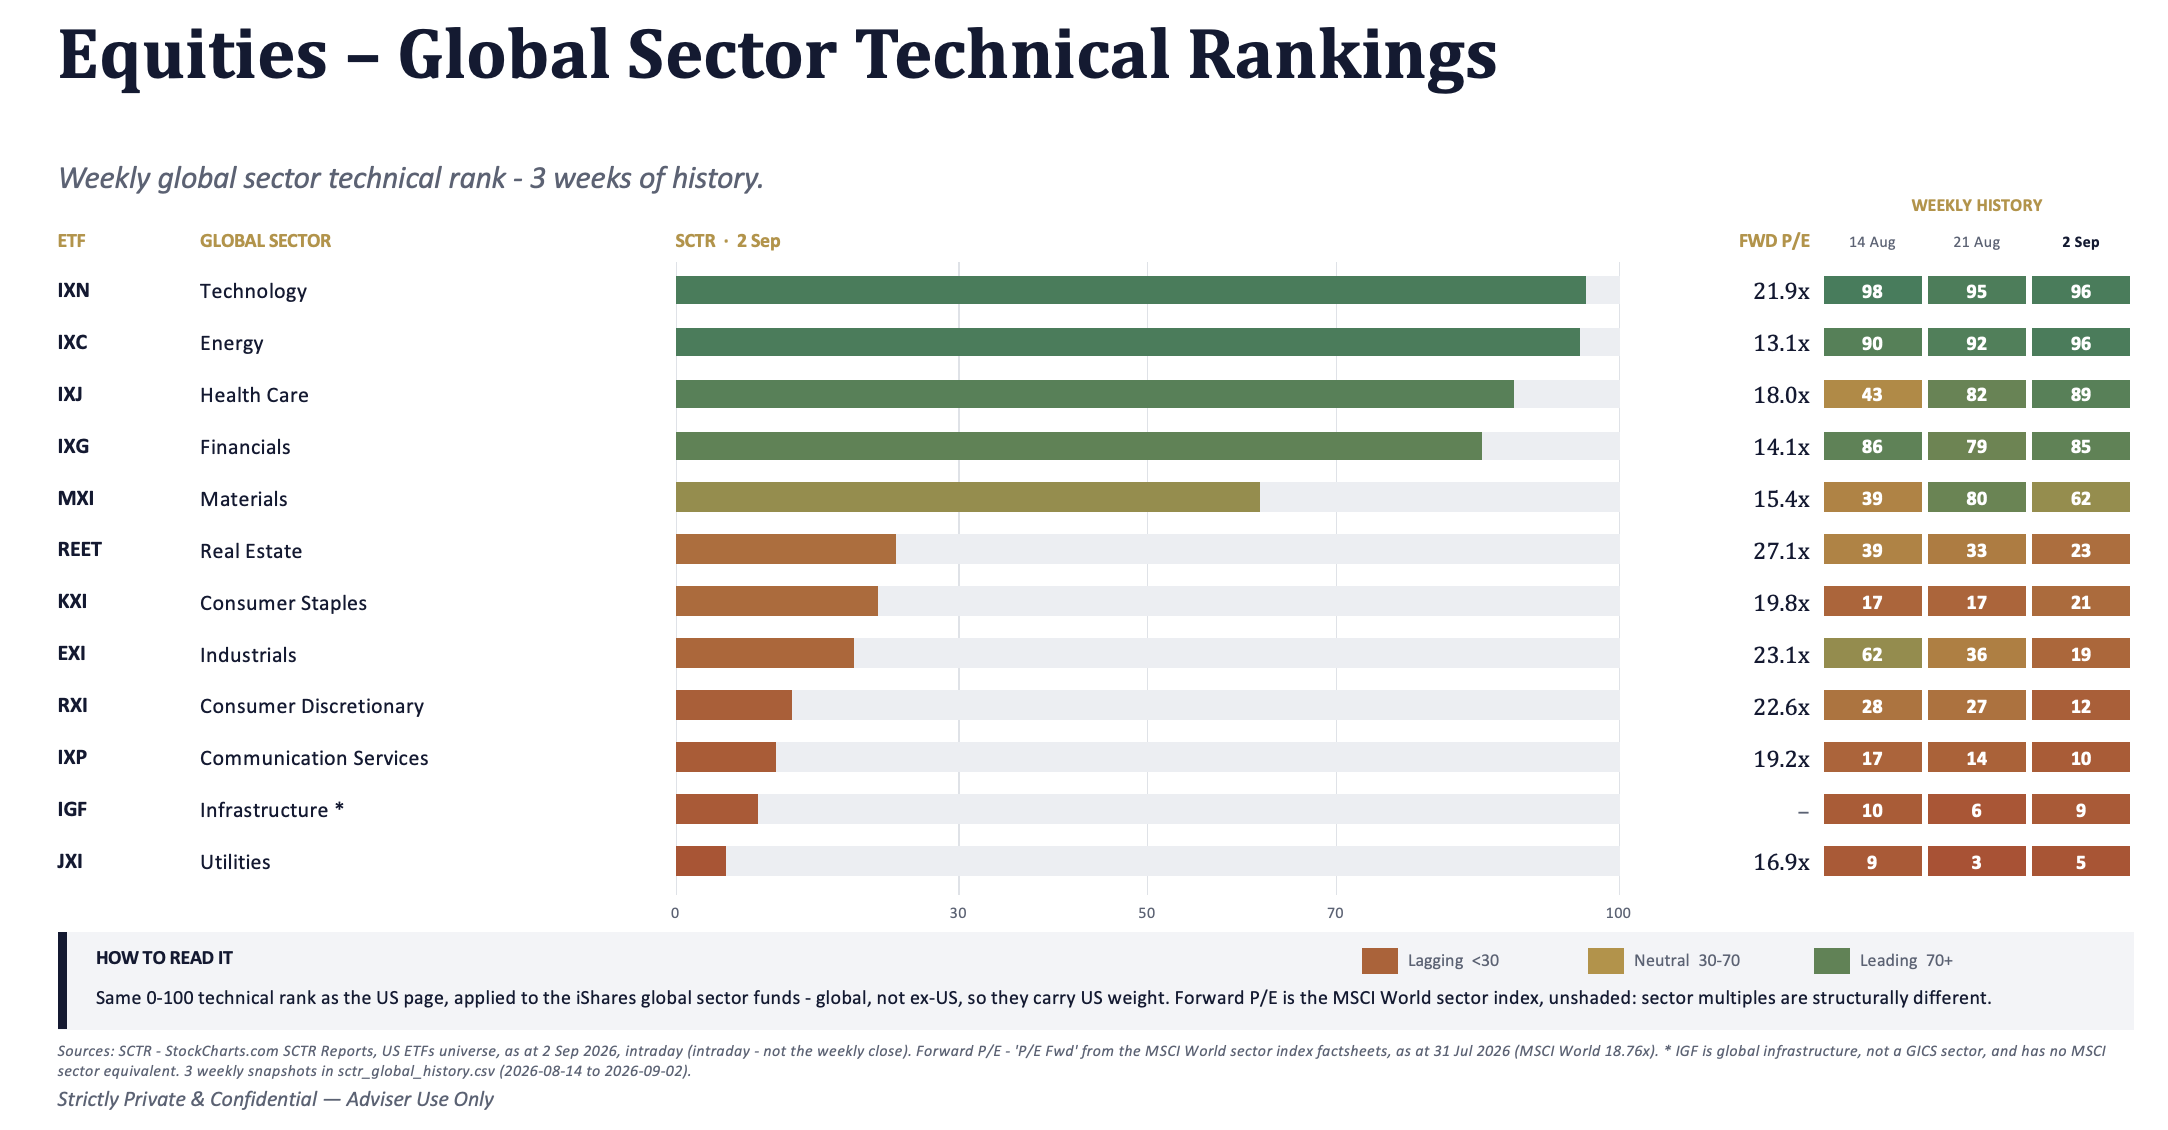
Tech, energy and healthcare remain the strongest trending sectors in the market. In an inflationary bust, the tech sector will have significant headwinds. Energy shares remain attractively valued today at just 13 times next years’ earnings.
Bonds
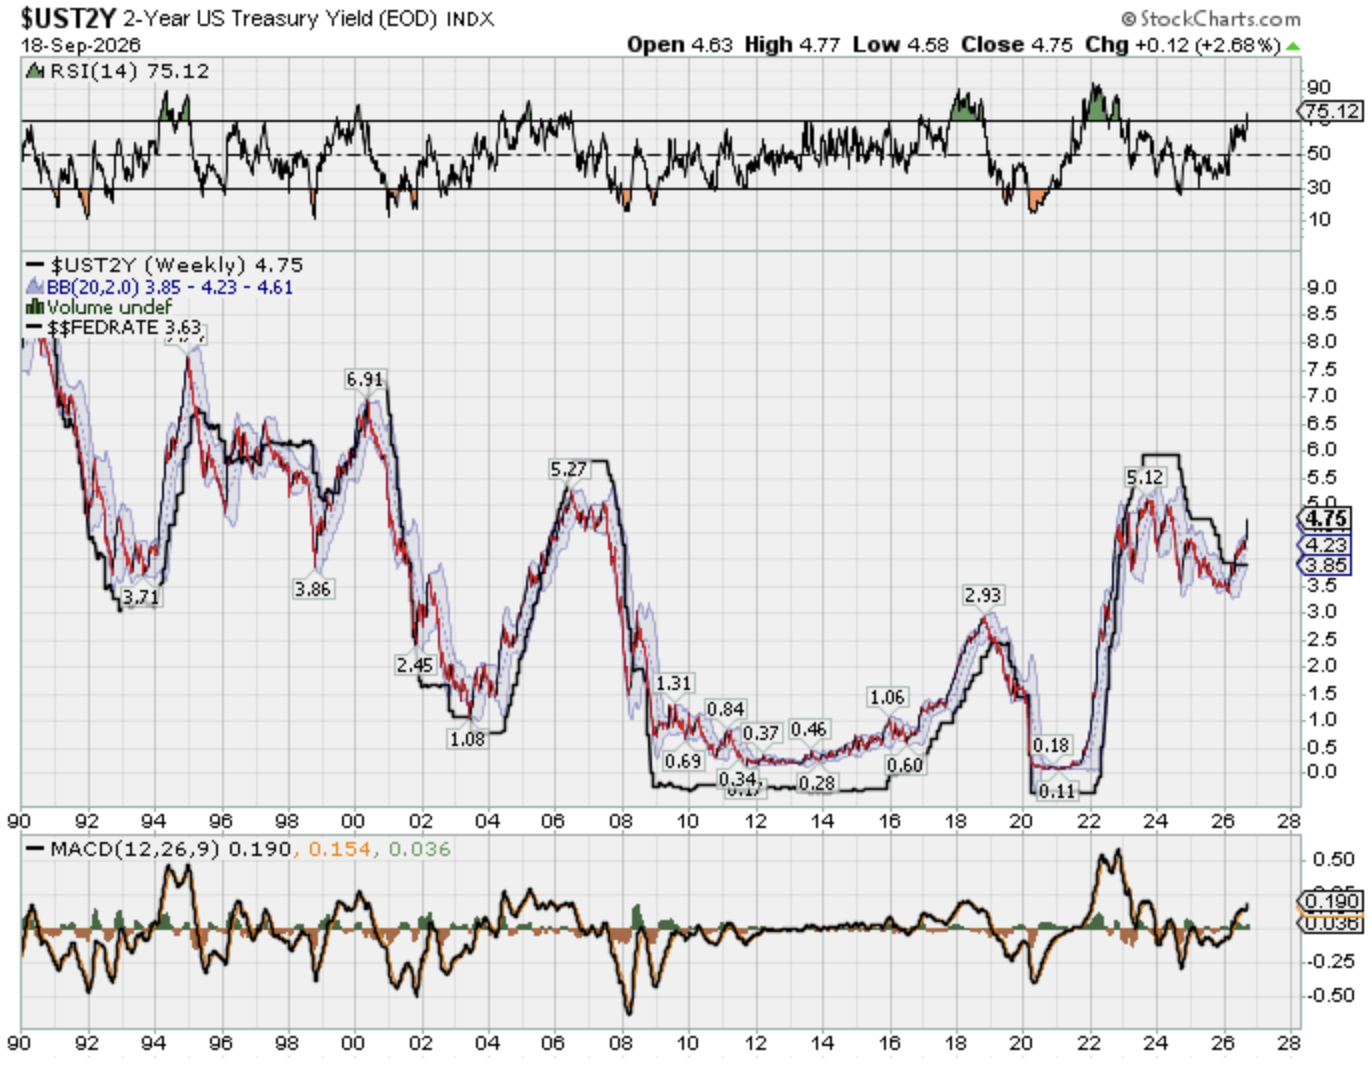
As long as US 2-year yields remain above the Fed Funds rate, the bond market is signalling that Kevin Warsh’ Fed is behind the curve - perhaps for reasons of robust economic growth, or excessive inflation, or excessive government deficits, or a mix thereof. More concerning for Treasury and Fed officials is the fact that 10-year yields continue their climb above 5% and 30-year yields trend towards 5.5%. This is not what you want to see with trillions of dollars of debt to roll over the next 24 months.
Gold
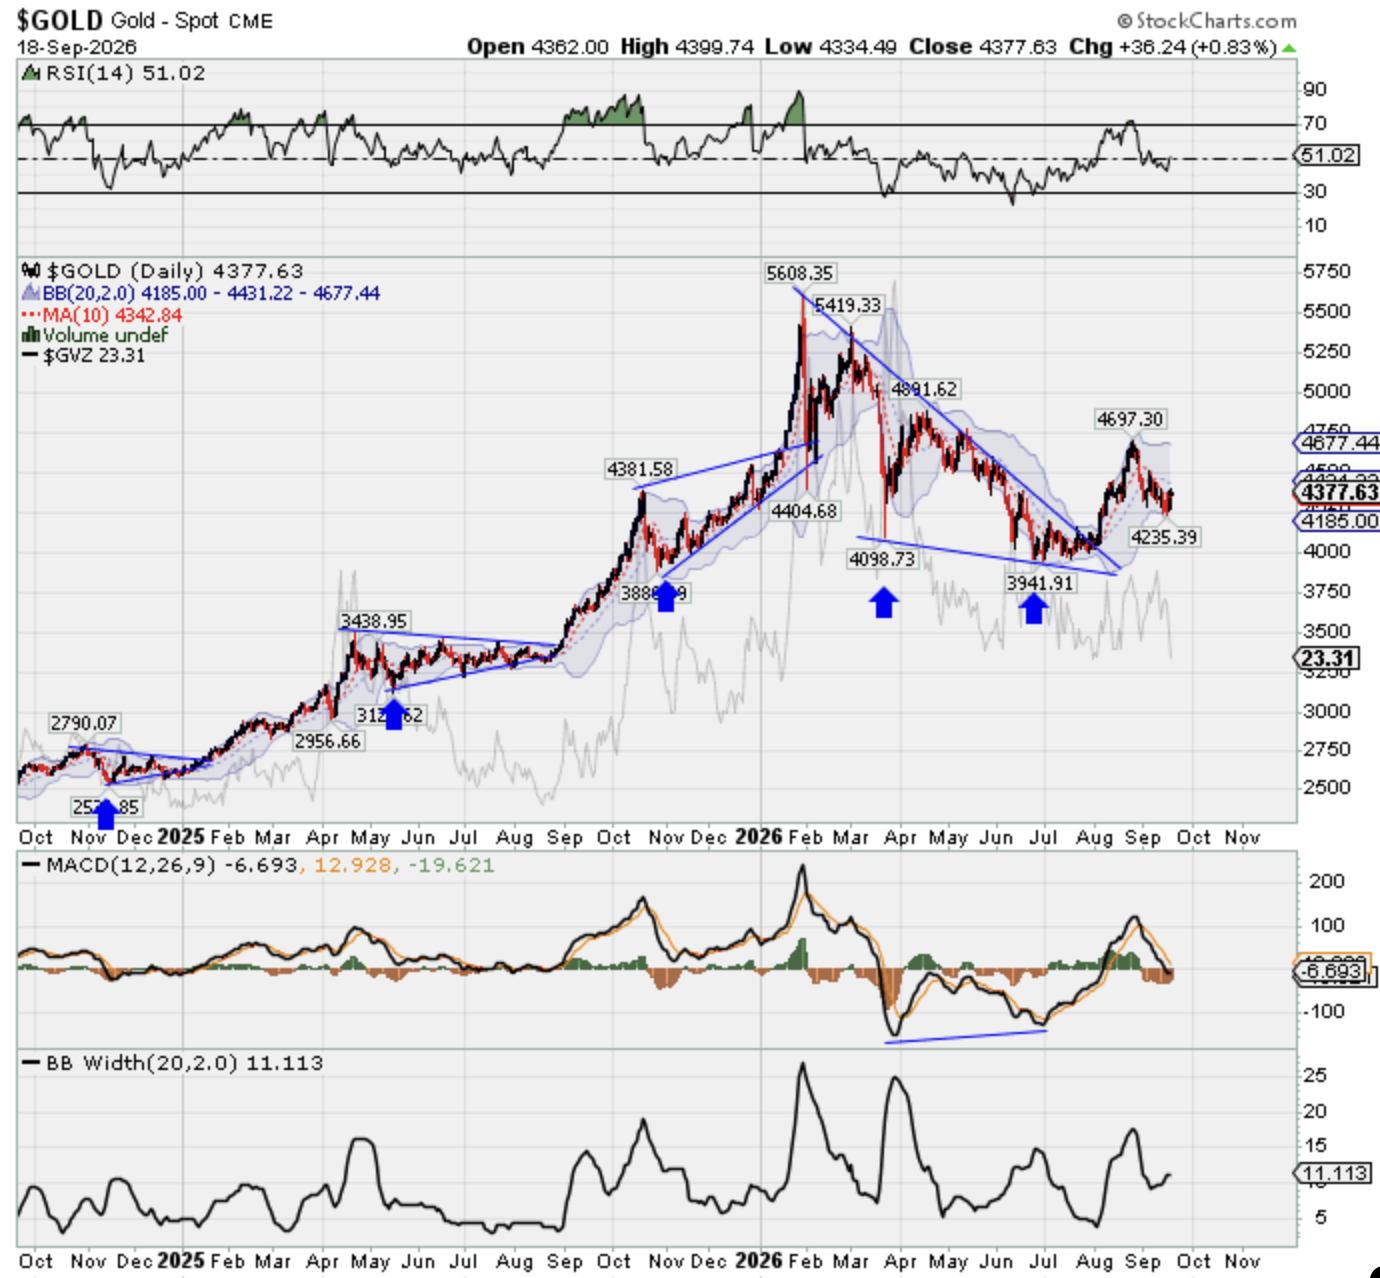
Gold begins week 12 of its weekly cycle. Gold’s first daily cycle added +8%. A second daily cycle followed that has treaded water with little forward progress, eating up time. Gold may need more time to build energy before the next acceleration phase. Much will depend on the performance of the stock market in the weeks ahead. A risk-off even for equities could hold back the precious metals sector for a while, or may lead to stronger demand for safe haven assets. Clear $4,500 and odds begin to favour acceleration.
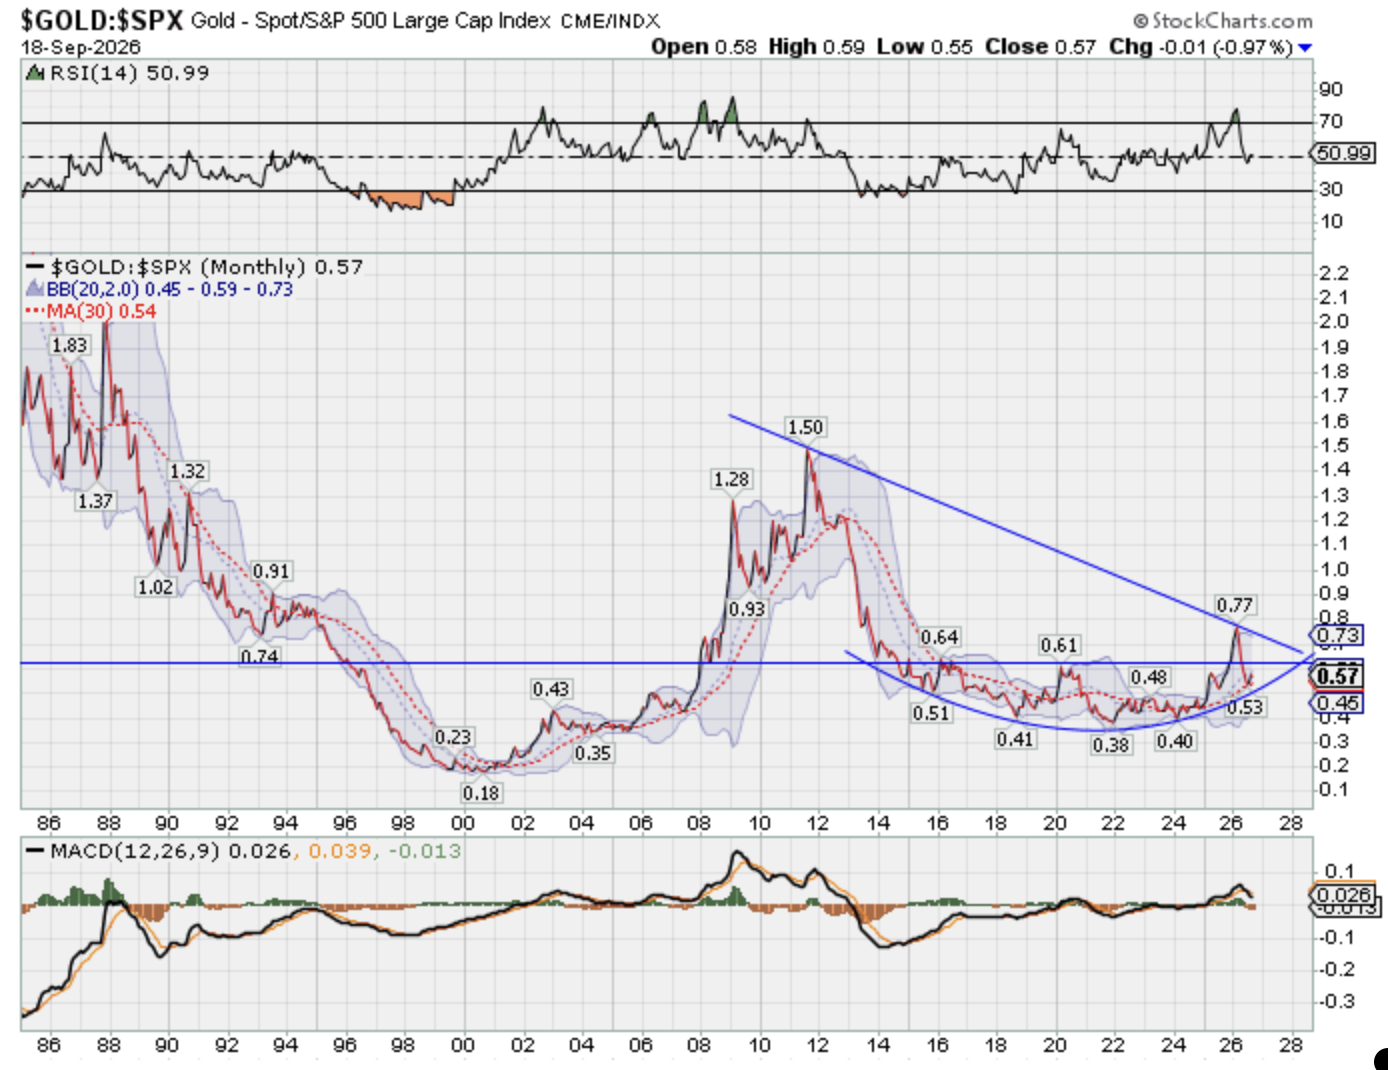
Bigger picture, today, one ounce of gold buys just 0.6 of a unit of the S&P 500. We are watching the relative performance of gold versus US equities closely and expect meaningful capital to enter the sector once gold clears overhead resistance on the chart below.
Enquiries, please contact brian@secureinvestments.ie
