For Whom the Bell Tolls
And other random market thoughts
Nobody rings a bell at the top, they say. Unless of course you have access to our technical trend indicator updates. Our TTI model timed the top of the 2007 and 2022 bull markets to perfection. We are getting close once again to another Sell signal. Will it be a pause to recharge this powerful equity bull market, or something more sinister? We are about to find out. This week we cover our latest views on stocks, bonds and precious metals. Please get in touch if you would like to learn more about our services.
Market Summary
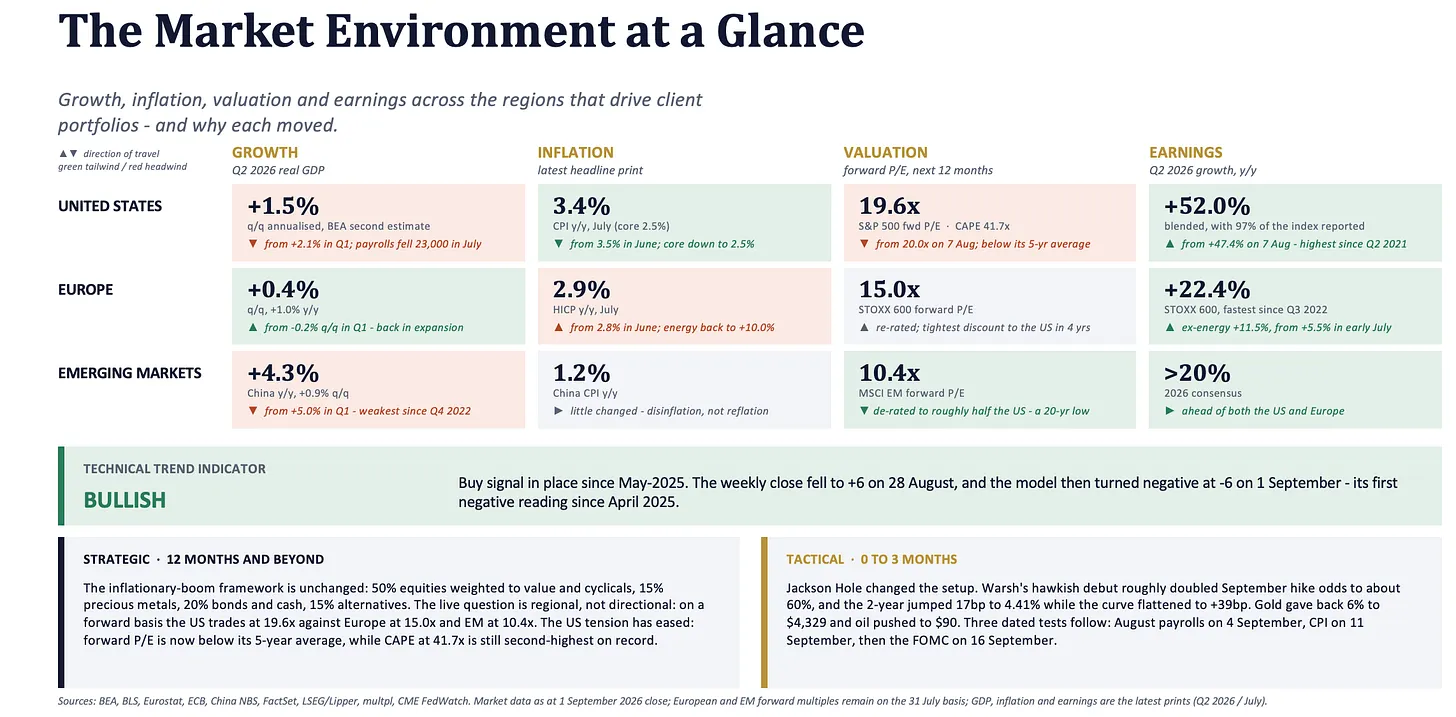
Here is a snapshot of current growth, inflation, valuation and earnings metrics for the US, Europe and emerging markets.
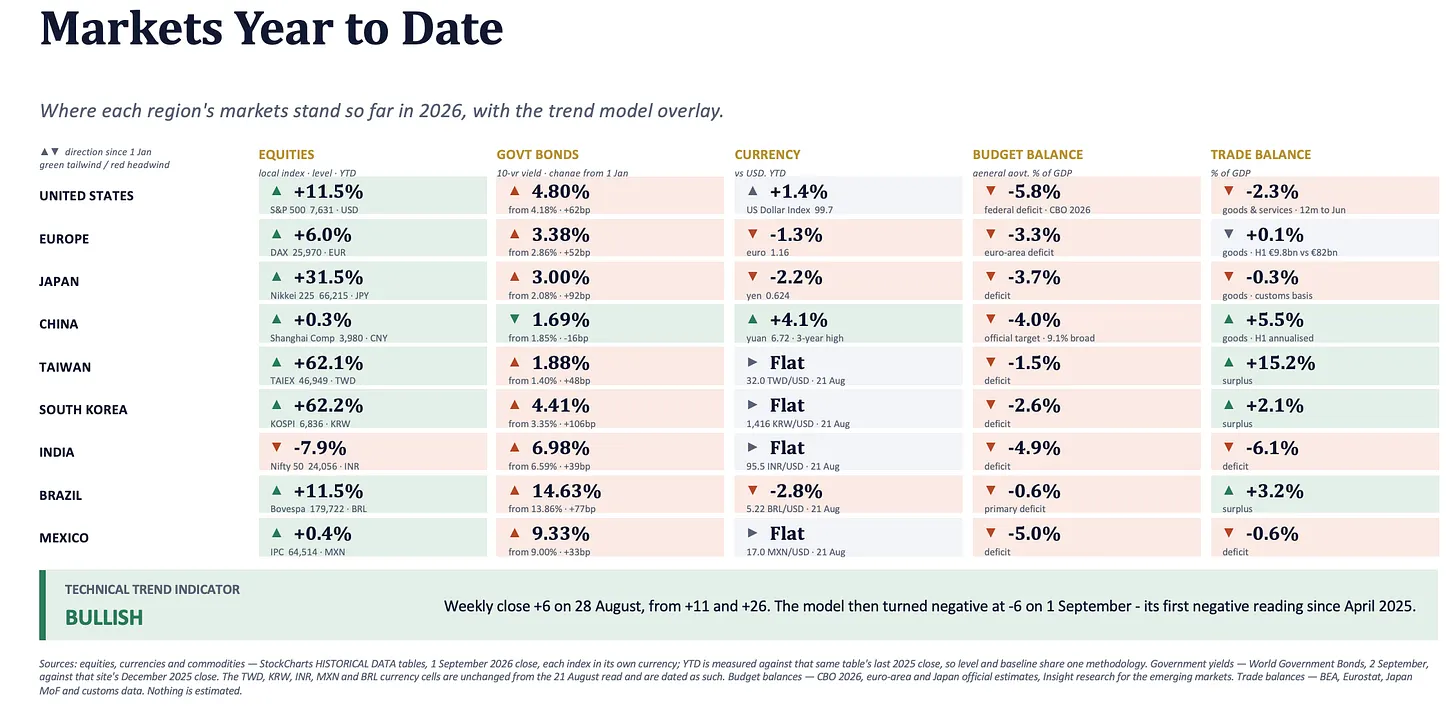
…. and some key market performance statistics year-to-date.
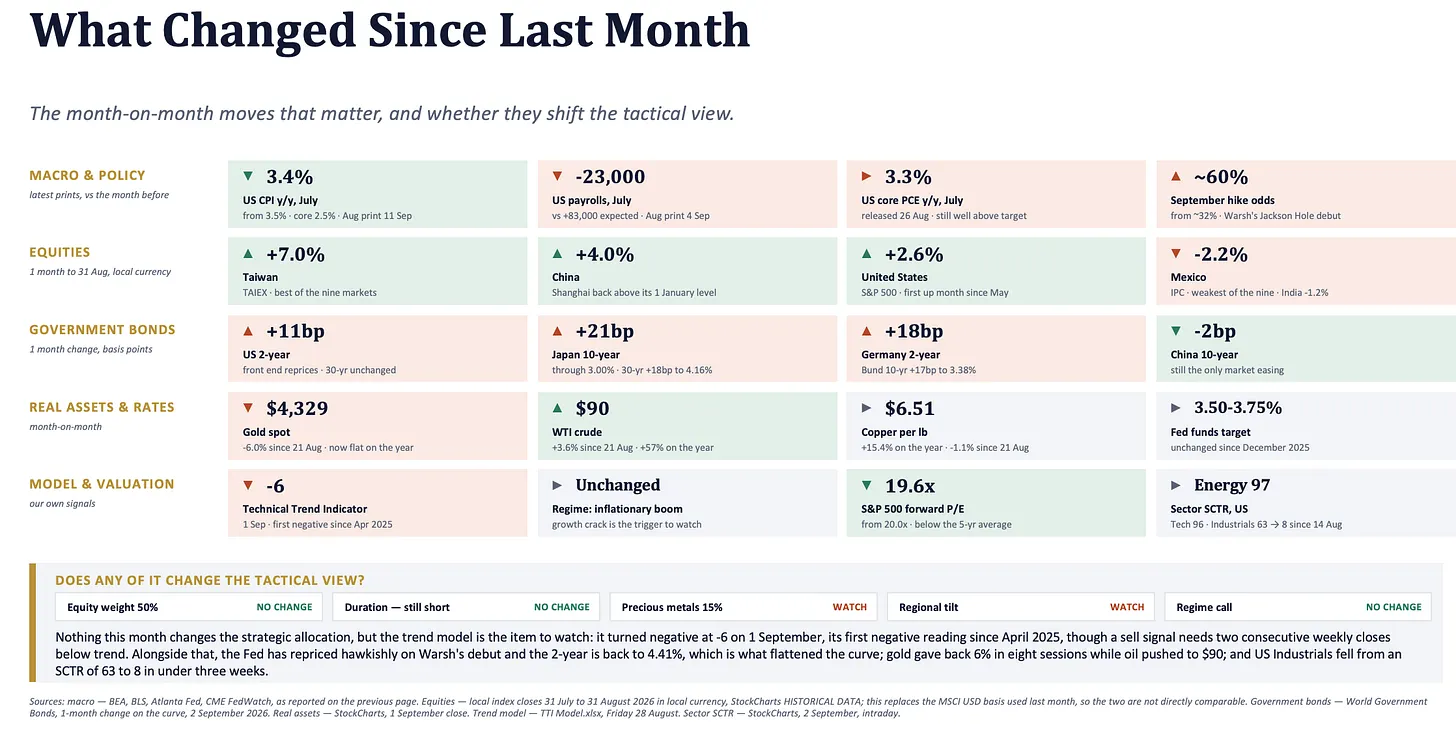
What has changed in August?
Quadrant/Regime - Inflationary Boom
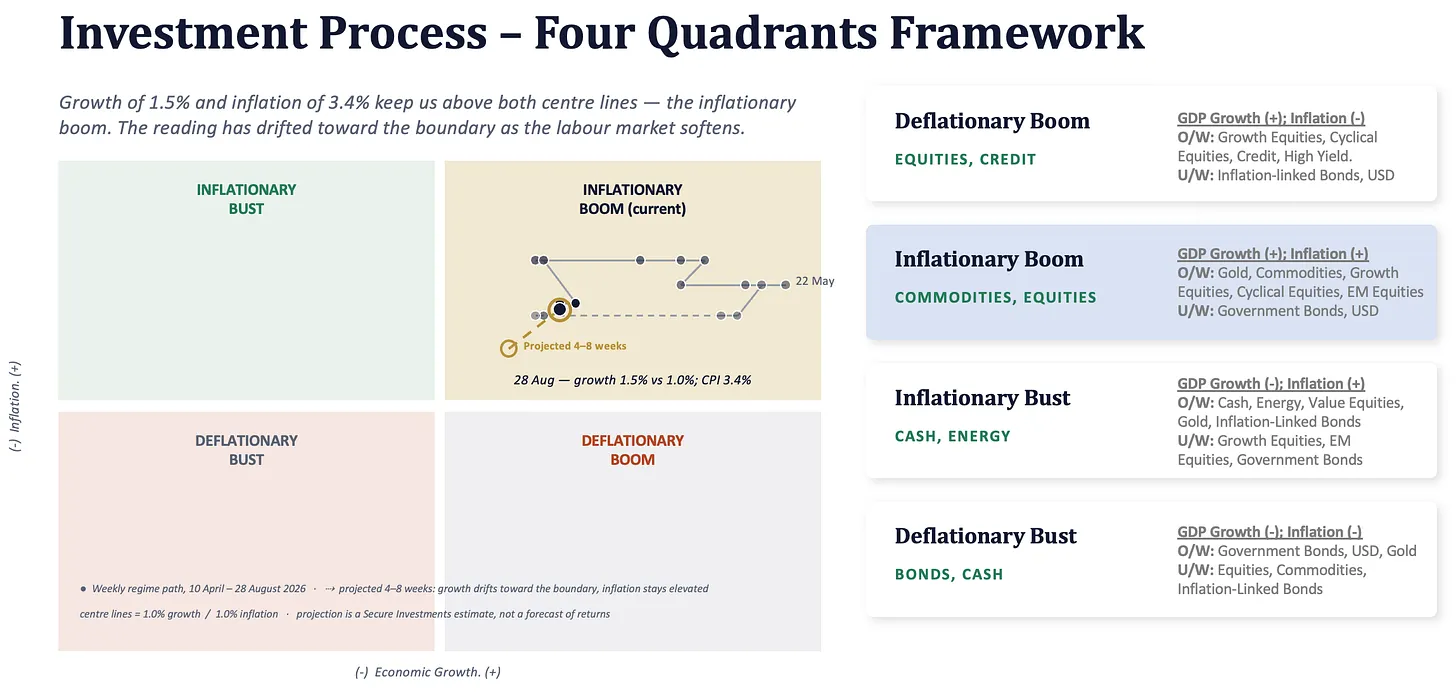
We remain in an inflationary boom, a period of real economic growth and rising inflation, when equities tend to outperform energy prices, and gold outperforms US Treasuries. Rising energy prices in recent weeks have started to challenge the inflationary boom narrative.
Equities
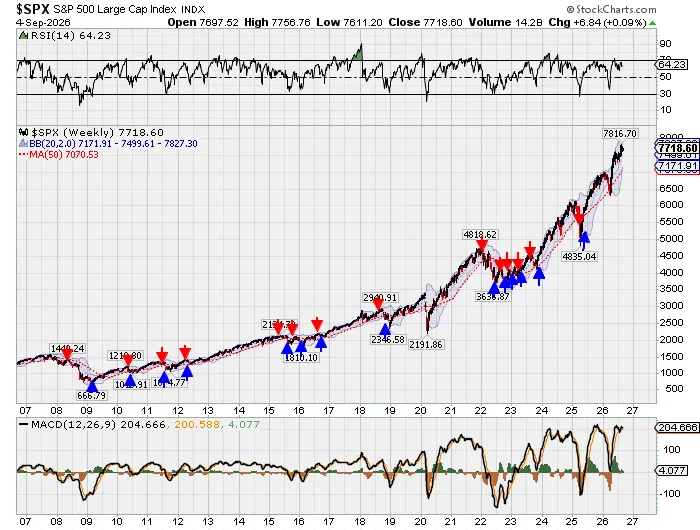
Our Technical Trend Indicator remains bullish, but closed the week just +3 points above its long-term average. We need two consecutive weekly closes below trend for a sell signal to take effect. We remain positioned 20% equities / 15% bonds / 45% precious metals / 20% cash in our multi-asset strategy. Our equity exposure is in the energy and materials sectors.
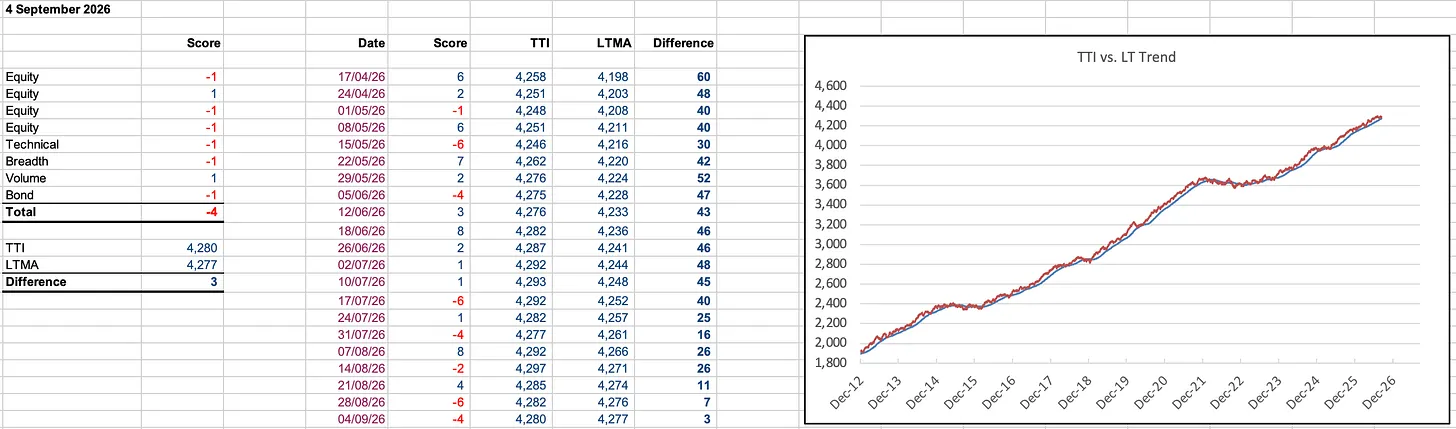
No major change yet to the technical picture. All indicators continue to trend in bullish mode, with some signs of mean reversion happening beneath the surface. The US market made 42 net new lows last week, not something you like to see in a healthy bull market.
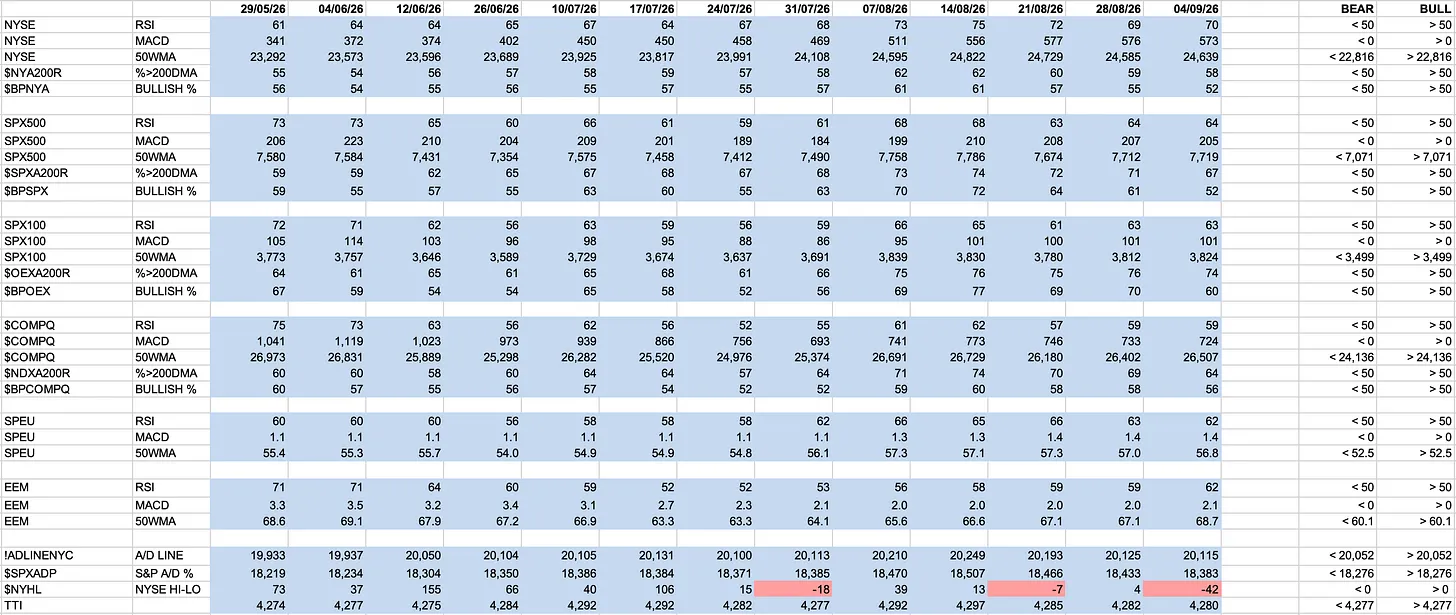
In an inflationary boom, equities outperform energy, gold outperforms US Treasuries, and gold also outperforms equities over time. Gold has been correcting in price in 2026 after a huge move last year and has been underperforming the S&P 500 in recent months. That trend is slowly starting to turn now back in favour of the precious metal. Gold has already started to outperform US Treasuries on 10 day, week, month and 20 day, week, month moving average bases.
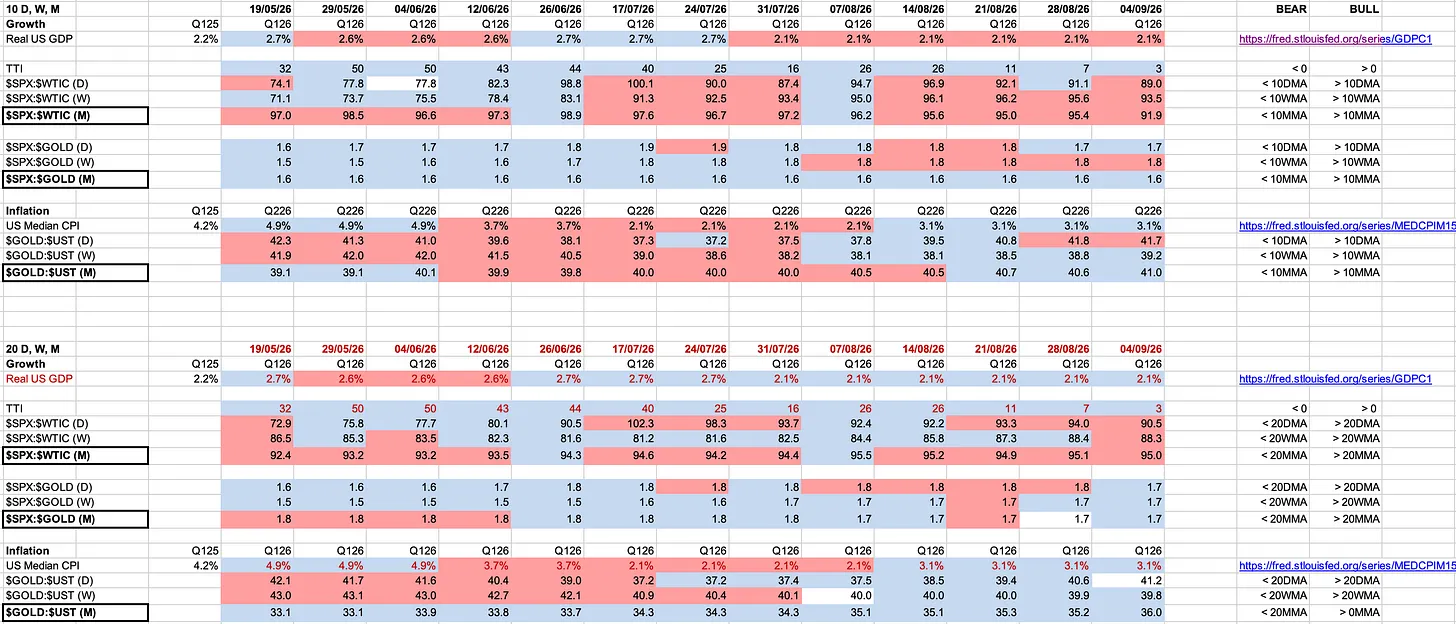
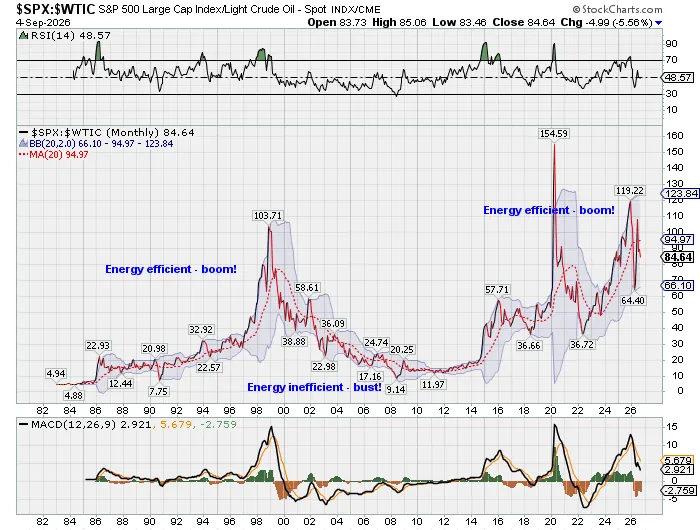
More concerning, stocks have started to underperform energy prices in recent weeks, given the recent rise in crude oil, a trend we are closely watching. If this trend persists, the risks of an inflationary bust increase meaningfully. Today, one unit of the S&P 500 buys a significant 85 barrels of crude oil. Oil is cheap in relative terms.
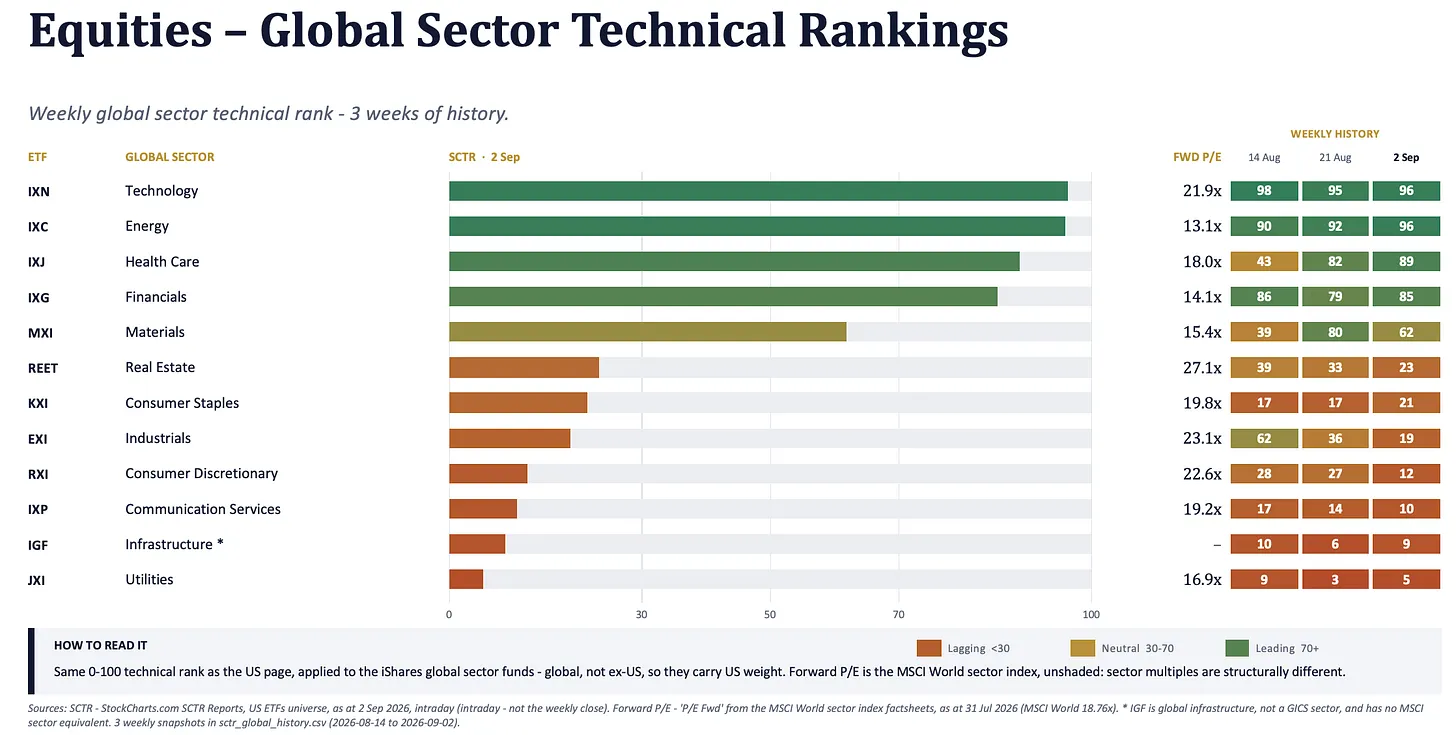
Tech, energy and healthcare are the strongest trending sectors globally. Energy remains one of the cheapest sectors in the market today.
Bonds
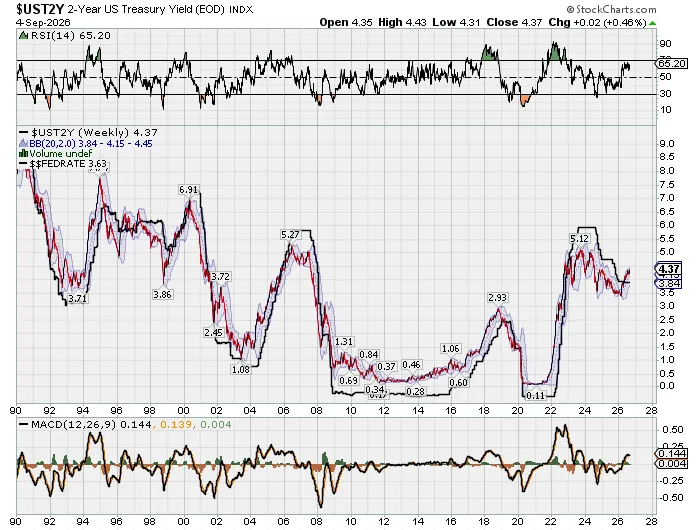
At Jackson Hole, Fed Chair Kevin Warsh delivered a hawkish speech, an effort to take a firm stance on curbing inflation. While an immediate rate hike this month or next remains unlikely, the broader strategy is clear. Warsh and Treasury Secretary Scott Bessent are coordinating to drive a weaker US dollar, above-target inflation, negative real rates, and positive nominal growth—a formula designed to inflate away $40 trillion in national debt. Raising the Fed Funds rate contradicts this agenda and would undermine Bessent’s recent efforts to spark a rally in the Japanese Yen. 2-year Treasury yields will likely end up trading above the Fed Funds rate for quite some time to come as policymakers continue to run the economy hot. We are on the lookout for potential unintended consequences.
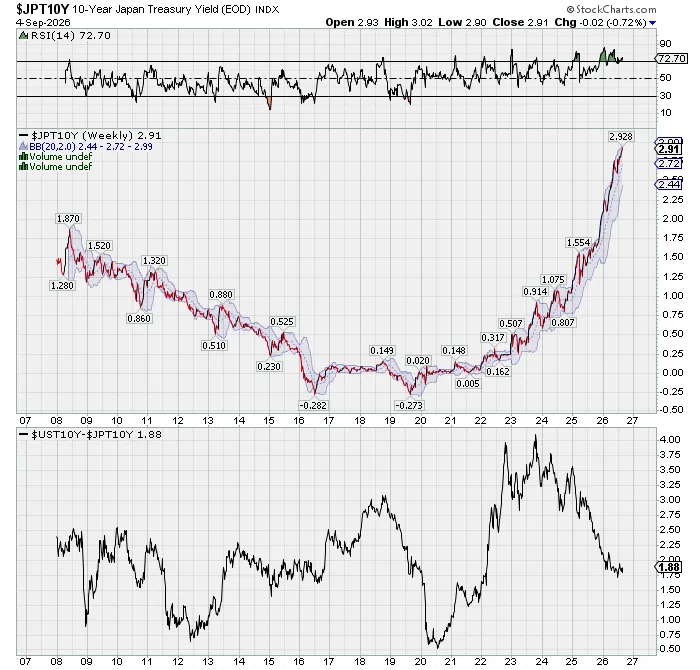
While the US faces high national debt—with annual net interest payments surpassing $1 trillion, consuming roughly 20% of tax receipts—its deep capital markets and reserve currency status keep its immediate fiscal position manageable.
Japan presents a more serious challenge. In recent years, Japanese Government Bond (JGB) yields have been on an exponential upward trajectory:
2023: 0.25% to 0.50%
2024: 0.50% to 1.00%
2025: 1.00% to 2.00%
2026: On course from 2.00% toward 4.00%
Exponential trends in financial markets frequently overshoot macroeconomic forecasts. Given Japan’s immense public debt-to-GDP ratio (exceeding 250%), a sustained rise in borrowing costs creates compounding pressures on the Bank of Japan (BOJ) and the Ministry of Finance. This exponential path of rising JGB yields is clearly unsustainable, suggesting we are approaching a breaking point soon.
Gold
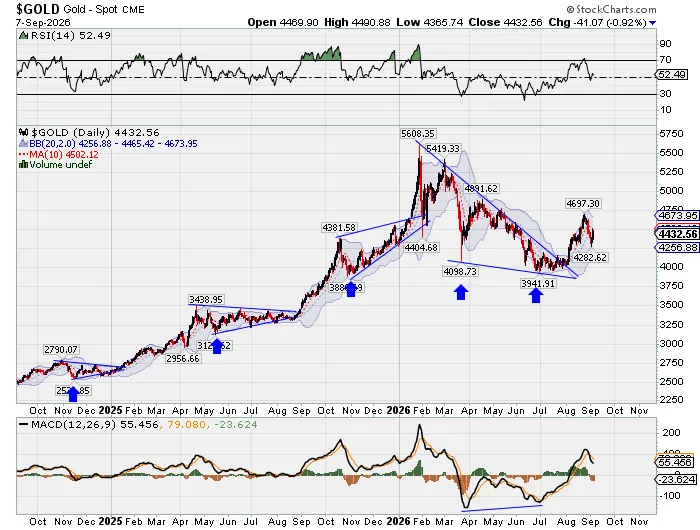
Gold has started a new weekly cycle, confirmed by the August breakout from the triangle consolidation that has been in place since the January 2026 highs. The first daily cycle of this new weekly cycle ended last week. Gold rallied +16%, declined -6% over a total of 45 trading days. All perfectly normal. This second daily cycle should break above the high of the first DC ($4,697) to confirm the rising trend remains in place. If that does not happen over the next few weeks, it will signal that gold needs more time to consolidate before the next meaningful rally. So, we could get another weekly cycle where gold just spins its wheels, before the next breakout. Or, gold could just accelerate from here. Time will tell.
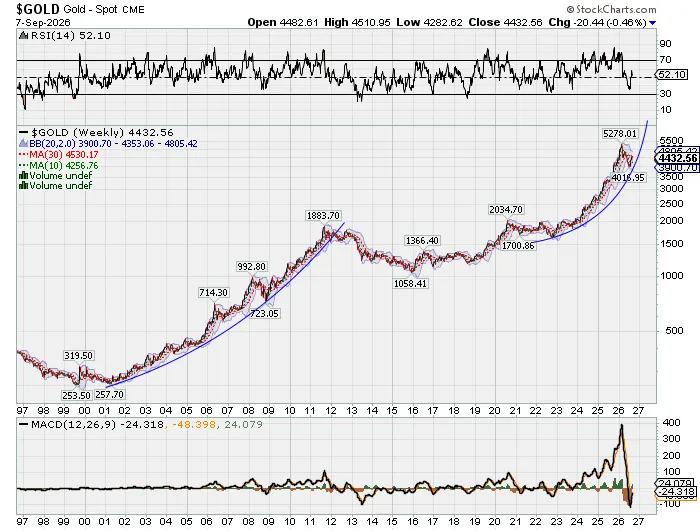
Bigger picture, gold is on an exponentially rising path, which I expect still has some years to run. I am looking for an acceleration into final top some time between 2028 and 2032. The trajectory has been set. Now we just need to be patient until the acceleration phase completes and the parabola finally breaks. It should end with a speculative frenzy and retail panic buying into the precious metals and miners.
In 2024 there were 400M shares outstanding in GDX, the gold mining sector ETF. Today there are a little over 300M shares outstanding. There is a distinct lack of investor demand in the sector, despite gold and many of the miners doubling in price over the last two years. GDX has seen $4 billion in net outflows from the sector over the last eighteen months. Remarkable.
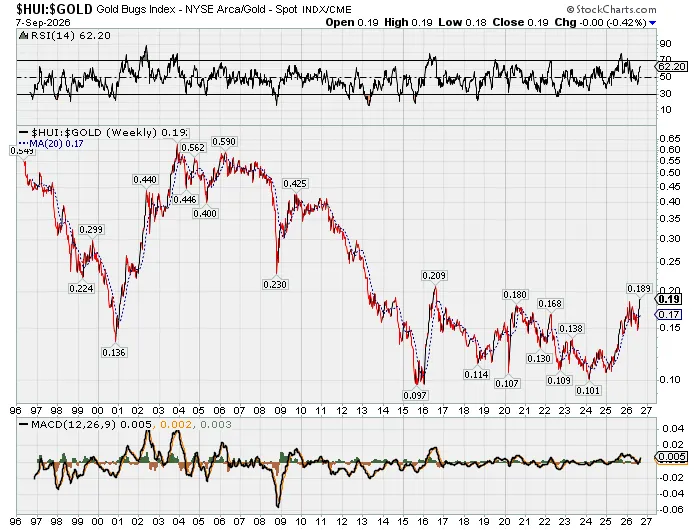
The next chart shows a long-term view of the Gold Bugs Index (another index of gold miners) relative to gold. The miners, unloved for over two decades, are about to get some of their mojo back. A breakout here shortly should see the miners deliver at least double the return of gold over the next three years.
I was recently asked whether gold could perform well in a rising interest rate environment. The 1970s offer valuable insight into what may lie ahead for precious metals investors today. Between 1971 and 1981, US 10-year Treasury yields more than doubled, climbing from 6% to 15%. Over that same period, inflation experienced two severe waves: surging from 3% in 1972 to a peak of 12% in 1974, cooling to 5% by 1976, and then spiking again to 14% in 1980.
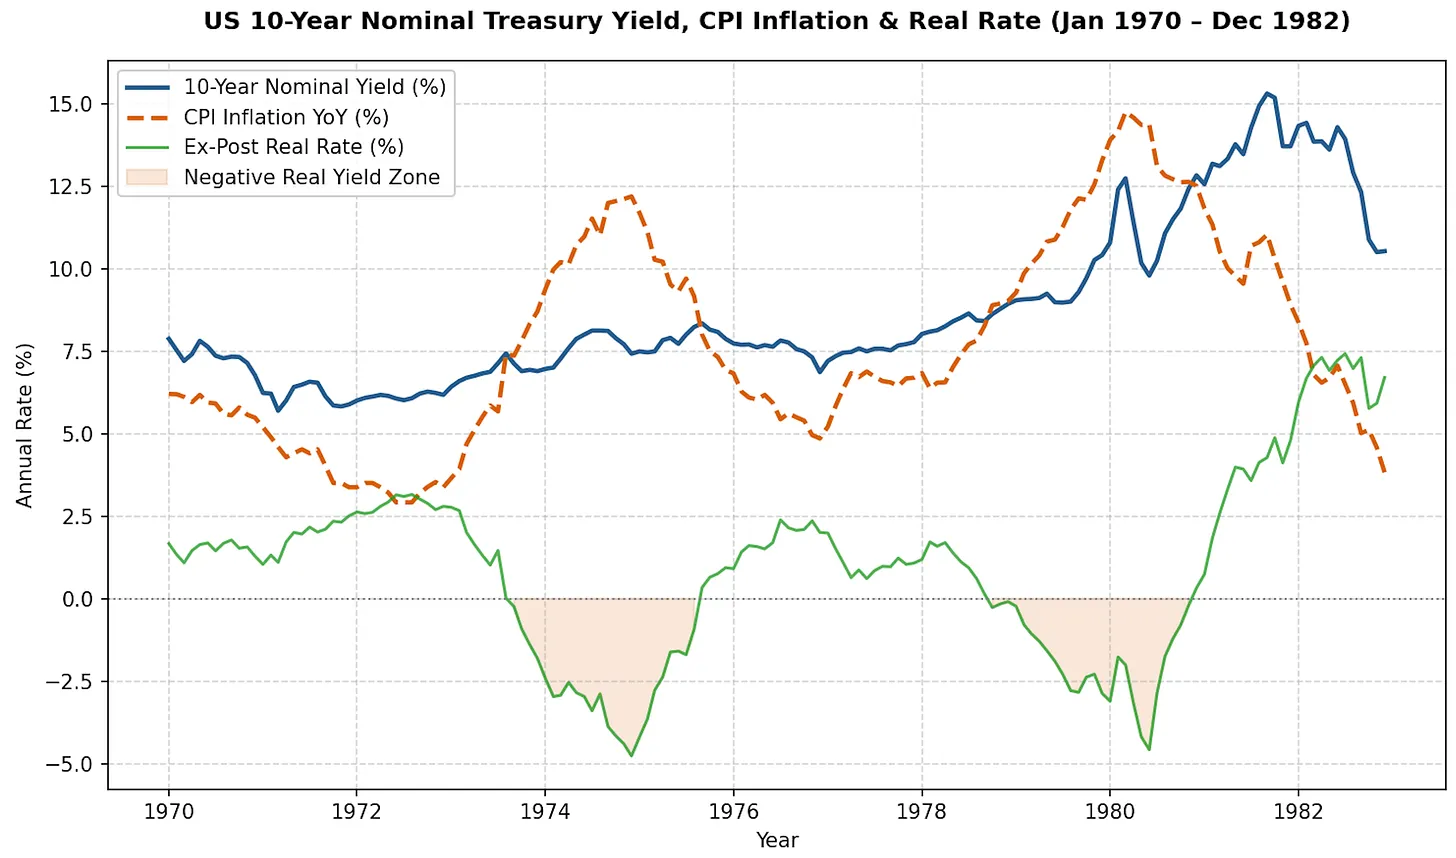
Despite sharply higher interest rates, gold rallied from $35 in 1971 to over $800 per ounce a decade later. The initial break from the $35 peg in 1971 was catalysed by the collapse of the Bretton Woods fixed-exchange system, demonstrating that surging inflation and monetary regime shifts can drive gold significantly higher, even alongside rising yields.
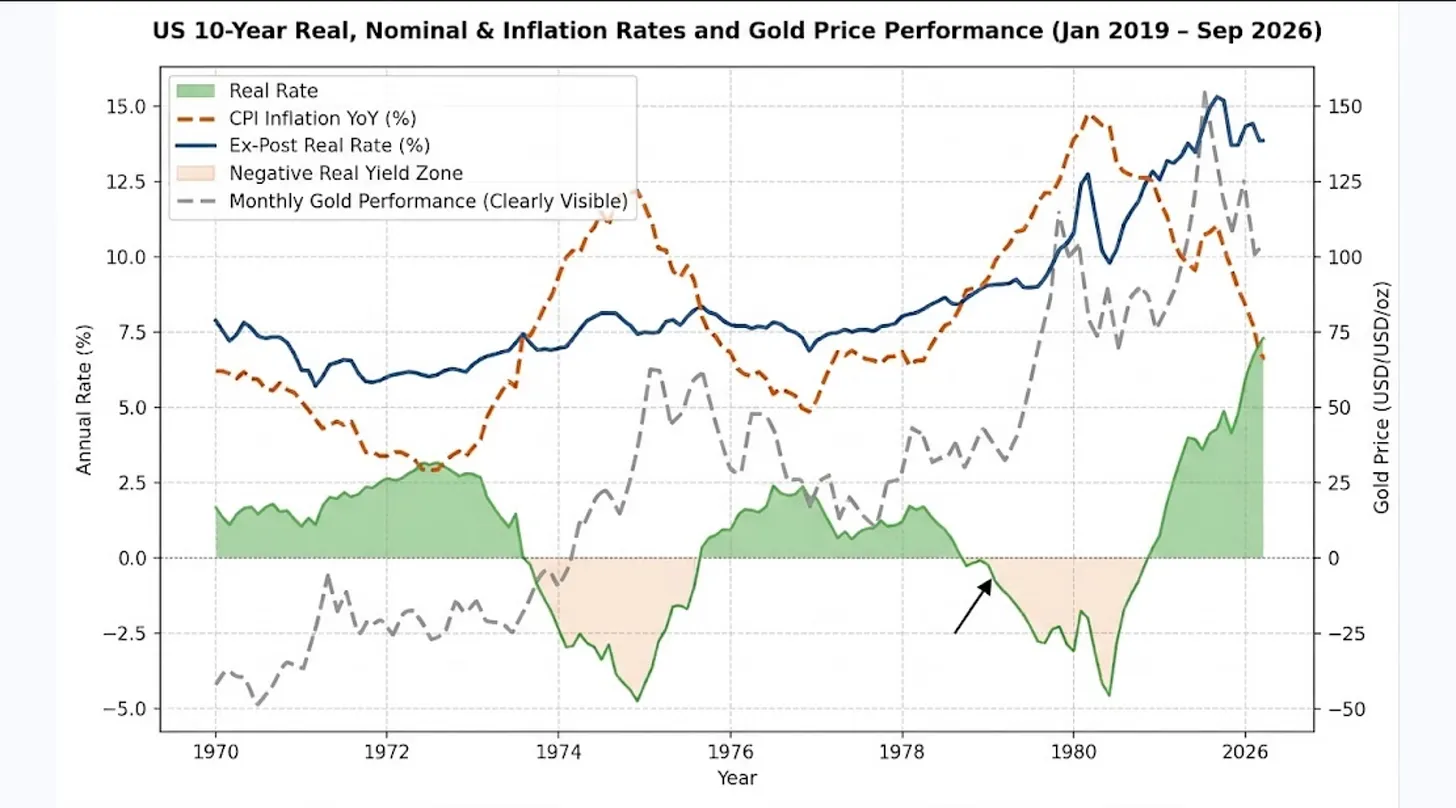
Heavy US spending during the 1960s created inflation and a surplus of offshore dollars, draining US gold reserves as foreign nations redeemed dollars for gold. Following the 1968 breakdown of central bank price-suppression efforts, President Richard Nixon officially "closed the gold window" on August 15, 1971, ending dollar convertibility and allowing gold to float freely into a major bull market.
From 1980-2000, US Treasuries were the safe haven asset of choice. If you look at a relative chart of US Treasuries relative to gold over that time, you will see a beautiful trend, lower left to upper right. Gold was not needed then, and traded as such, to a point where it reached $250/oz in 2000. Add a late 1990’s stock market bubble, and this explains why, for a brief moment in time, gold reached its most undervalued level in history measured relative to US share prices. One ounce of gold bought just 0.18 of a unit of the S&P 500!
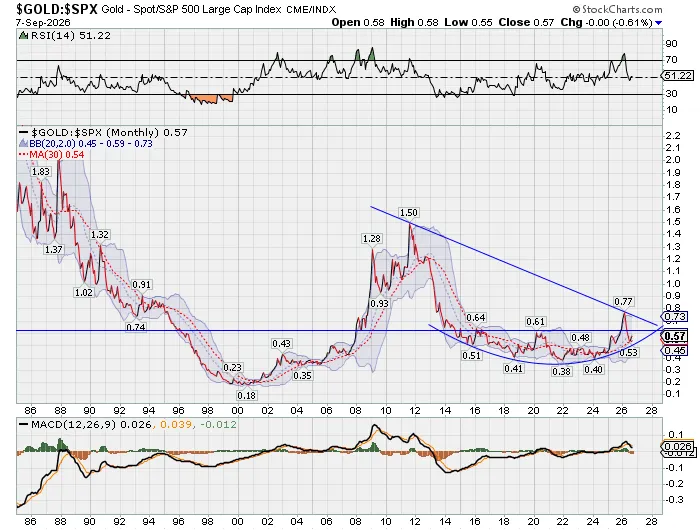
Today, one ounce of gold buys 0.6 of a unit of the S&P 500. I am looking hard for signs of speculative excess in the sector, and I fail to see any. Miners trade at half their historical value vs the metal. ETF outflows in 2023, 2024, the latecomers arrived in 2025 only to get punished in 2026. Central banks buying hand over fist. The retail market shrugs. If US Treasuries return as a store of value, and gold trades back at/below 1 unit of the S&P, and retail investors arrive to the precious metals sector in force, it will signal an end is near. But we are not there yet.
